Project Summary:
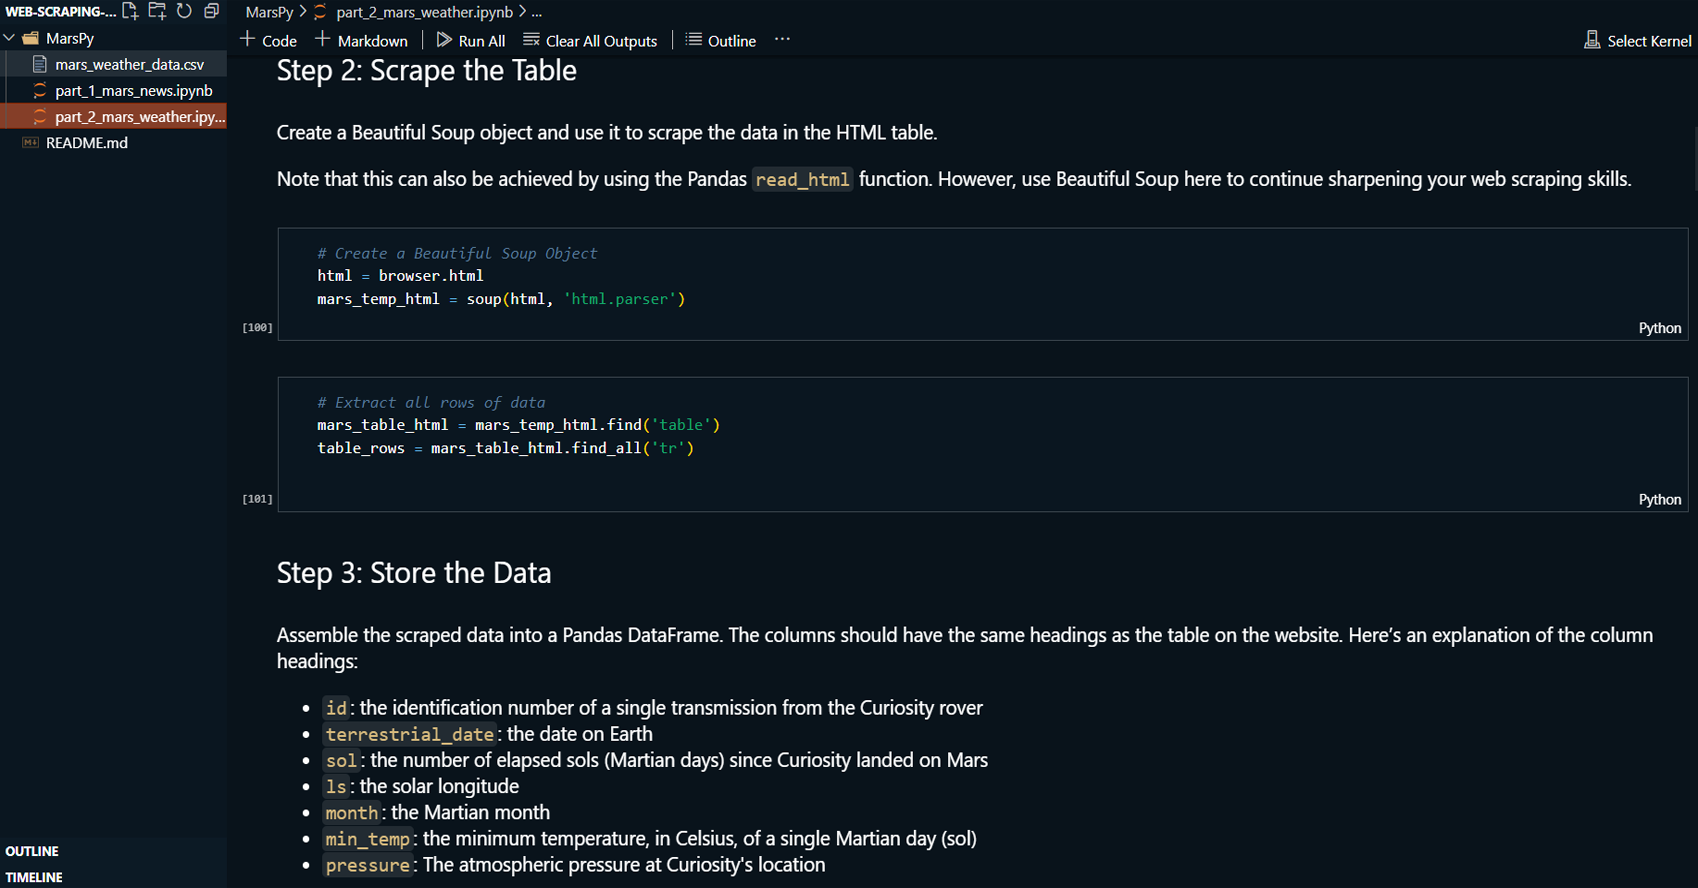
This project involves web scraping and data analysis to
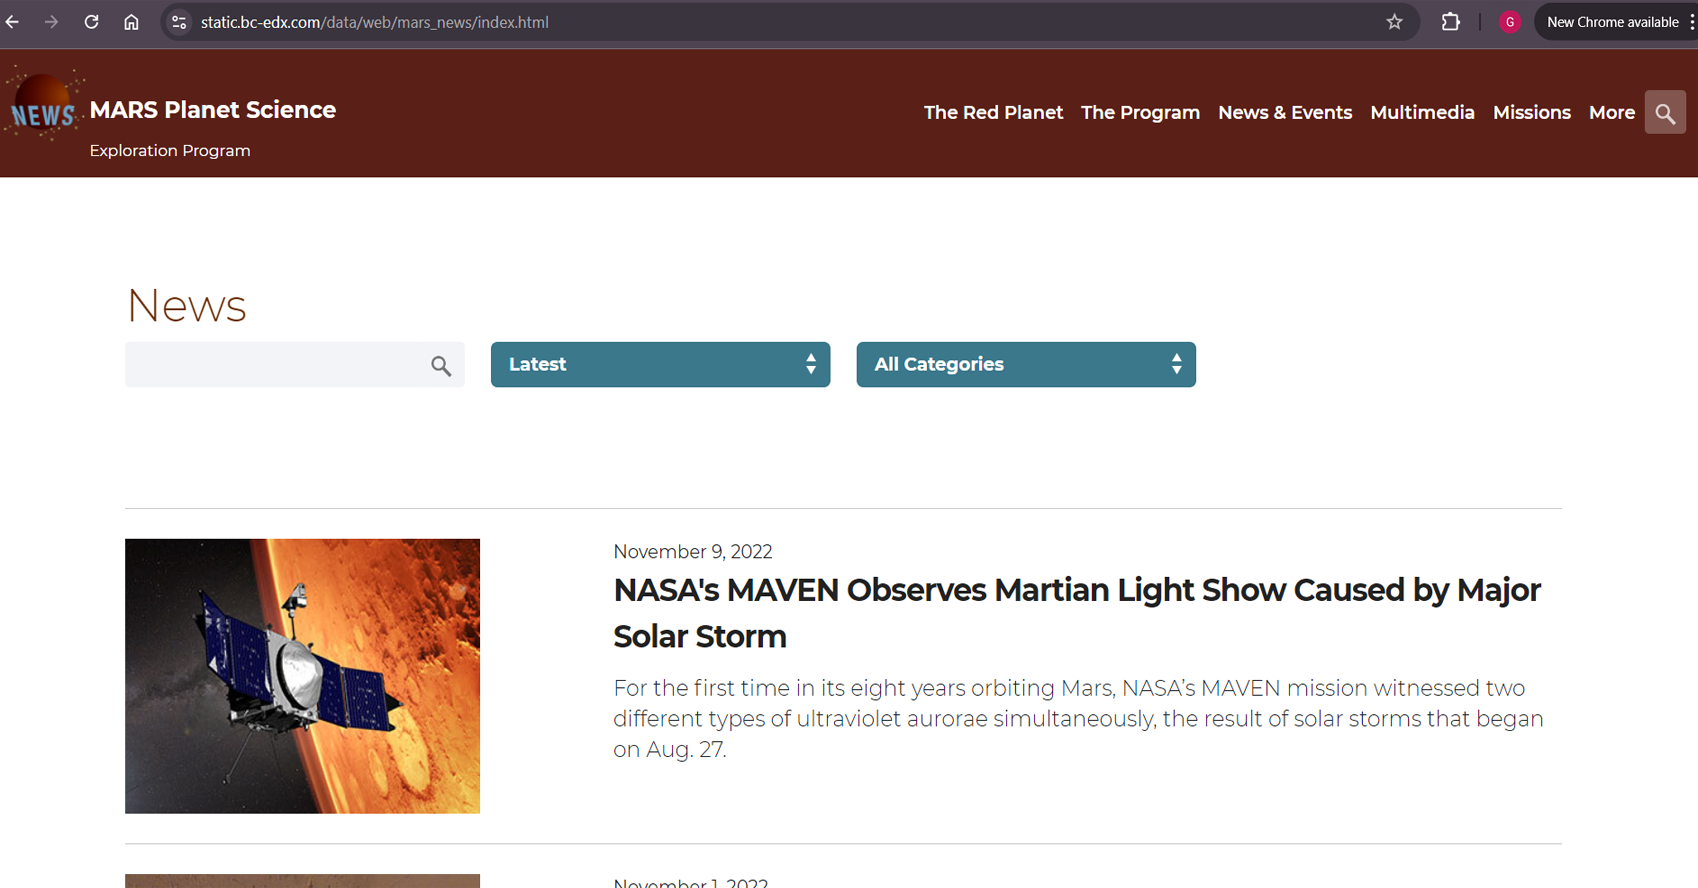
gather Mars-related news and weather data. The first part
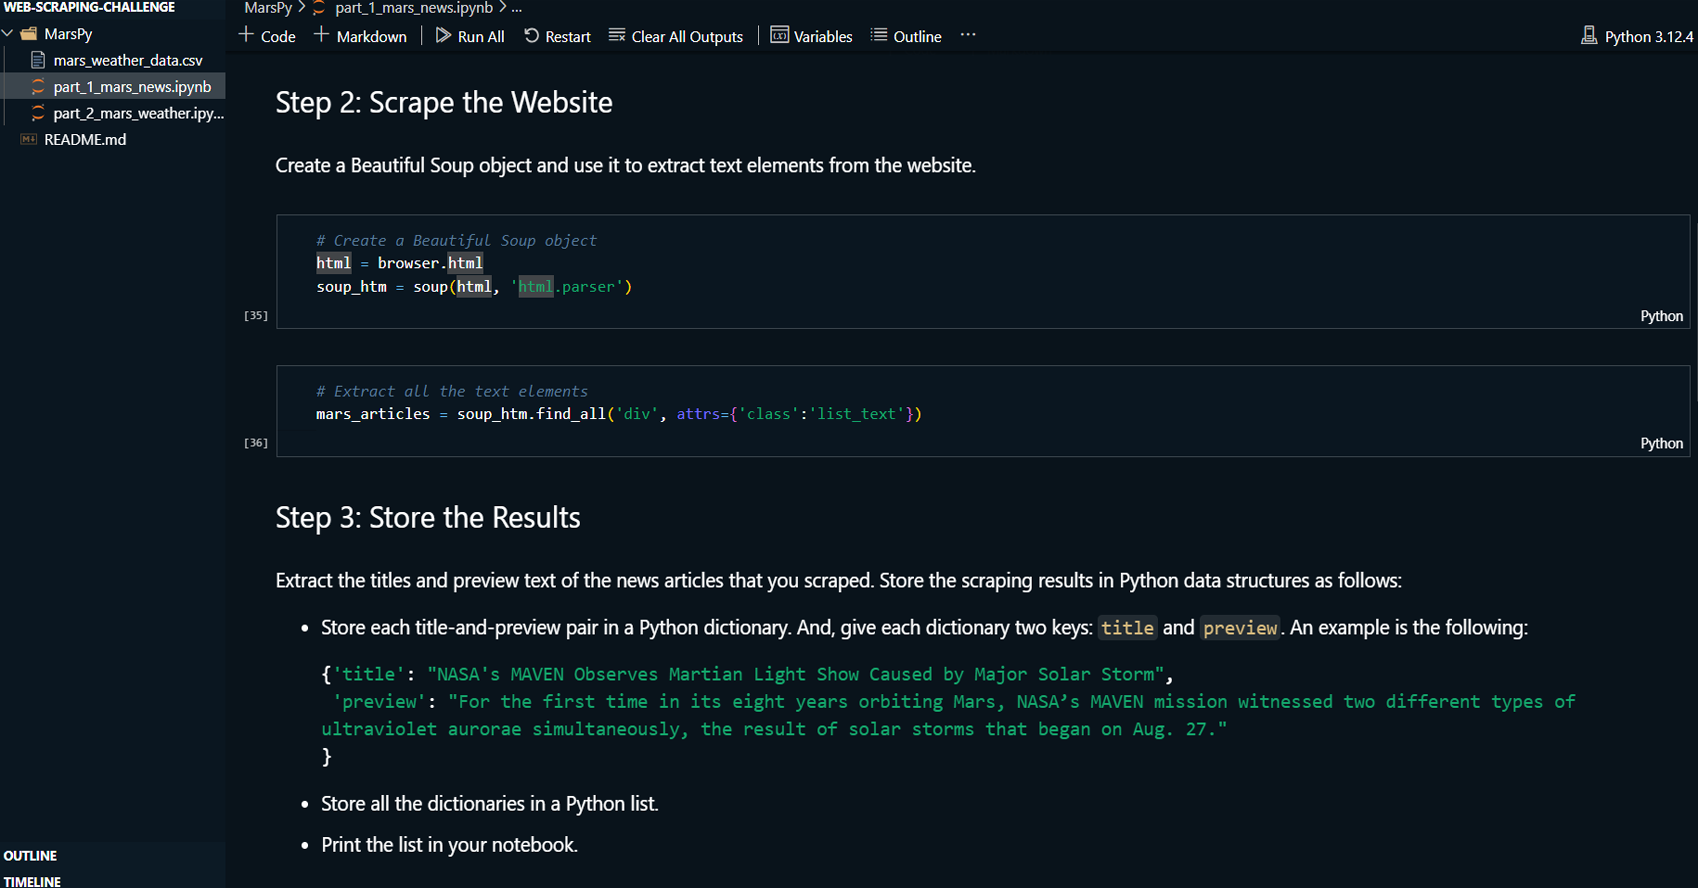
focuses on scraping titles and preview text from Mars news
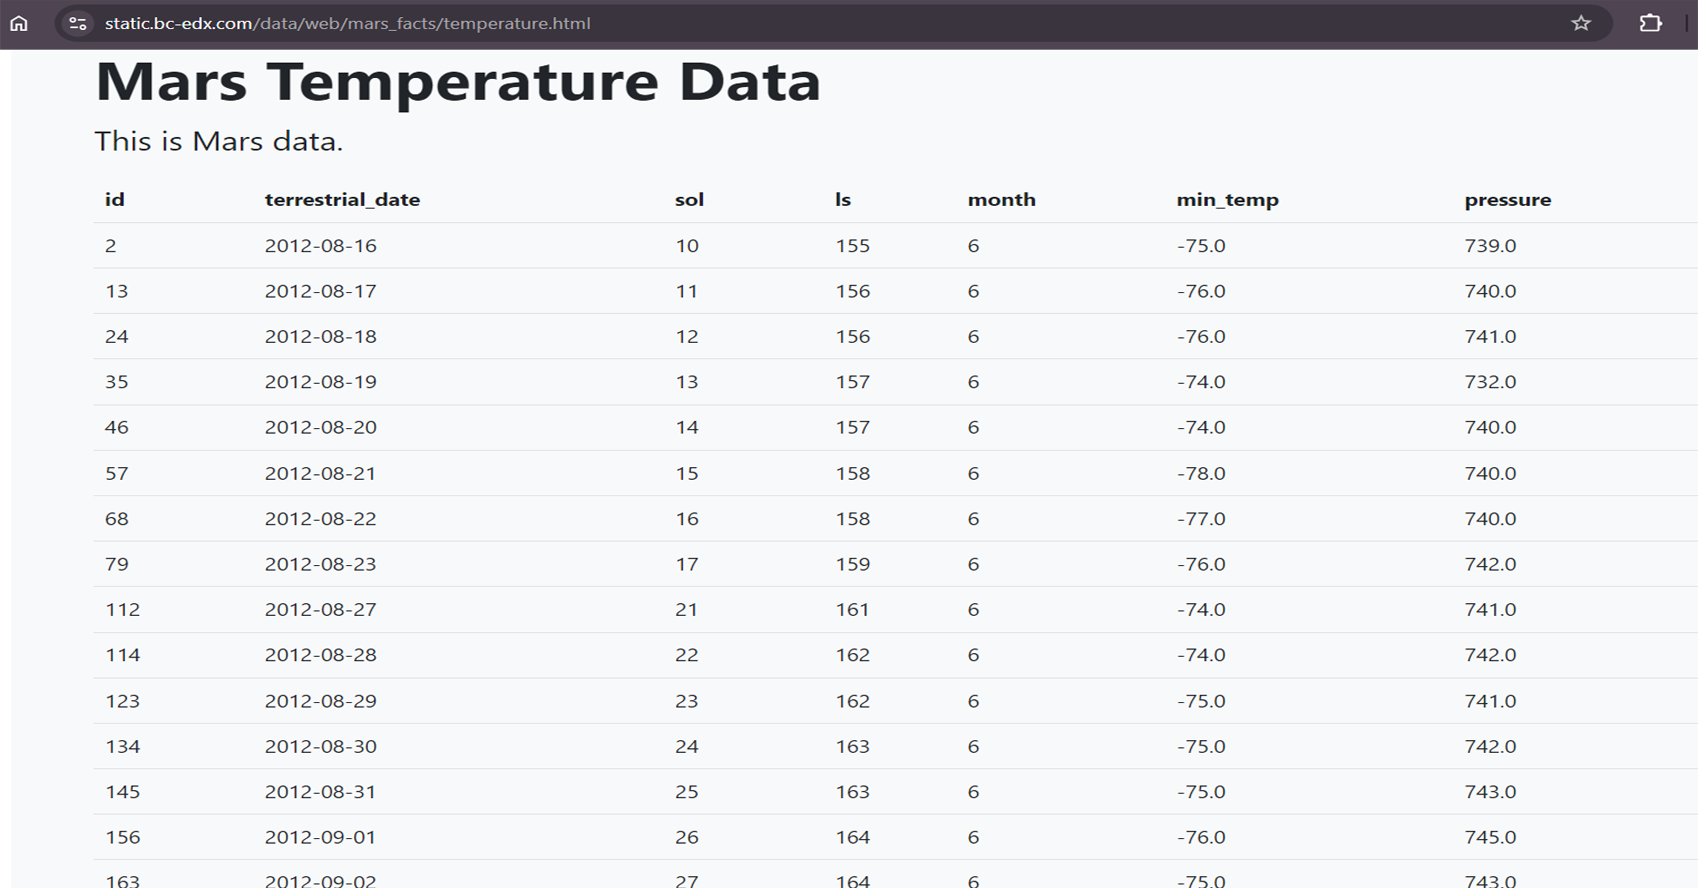
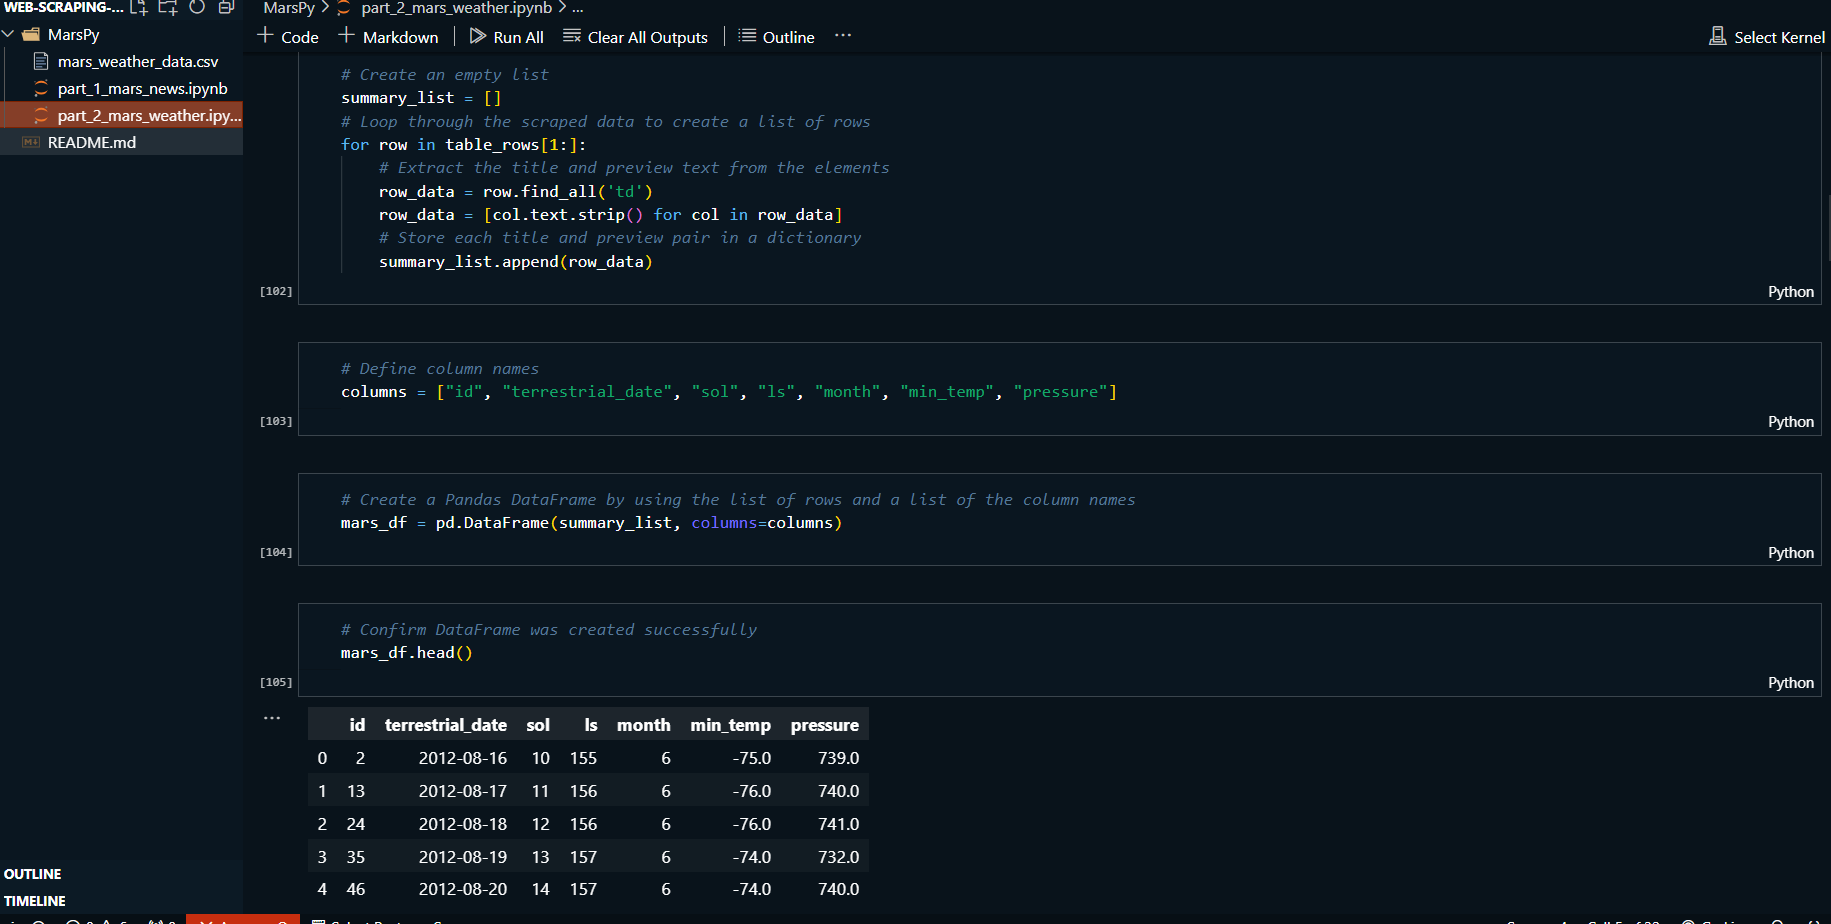
articles. The second part involves scraping Mars weather
data from an HTML table, analyzing it using pandas, and
creating visualizations to answer specific scientific
questions about Mars, such as identifying temperature trends
and atmospheric pressure variations. The project uses Python
with libraries such as Splinter, BeautifulSoup, Pandas, and
Matplotlib to automate browsing, scrape data, and perform
analysis.
Read More
Technologies:
-
Python:
-
Splinter: For automated browser
navigation and web scraping.
-
BeautifulSoup (bs4): For parsing
HTML and extracting data from websites.
-
Pandas: For assembling, cleaning,
and analyzing scraped data.
-
Matplotlib: For visualizing Mars
weather data (temperature and atmospheric pressure).
Python, SQL, and JavaScript (HTML, CSS).
-
Jupyter Notebook: For documenting and
running Python code.
-
CSV: Data was exported in a CSV format
for further analysis.
Contributions:
-
Web Scraping:
-
Used Splinter to automate browsing of the Mars news
site and the Mars Temperature Data Site.
-
Created BeautifulSoup objects to extract relevant
information (news article titles, preview texts, and
Mars weather data) from the HTML.
-
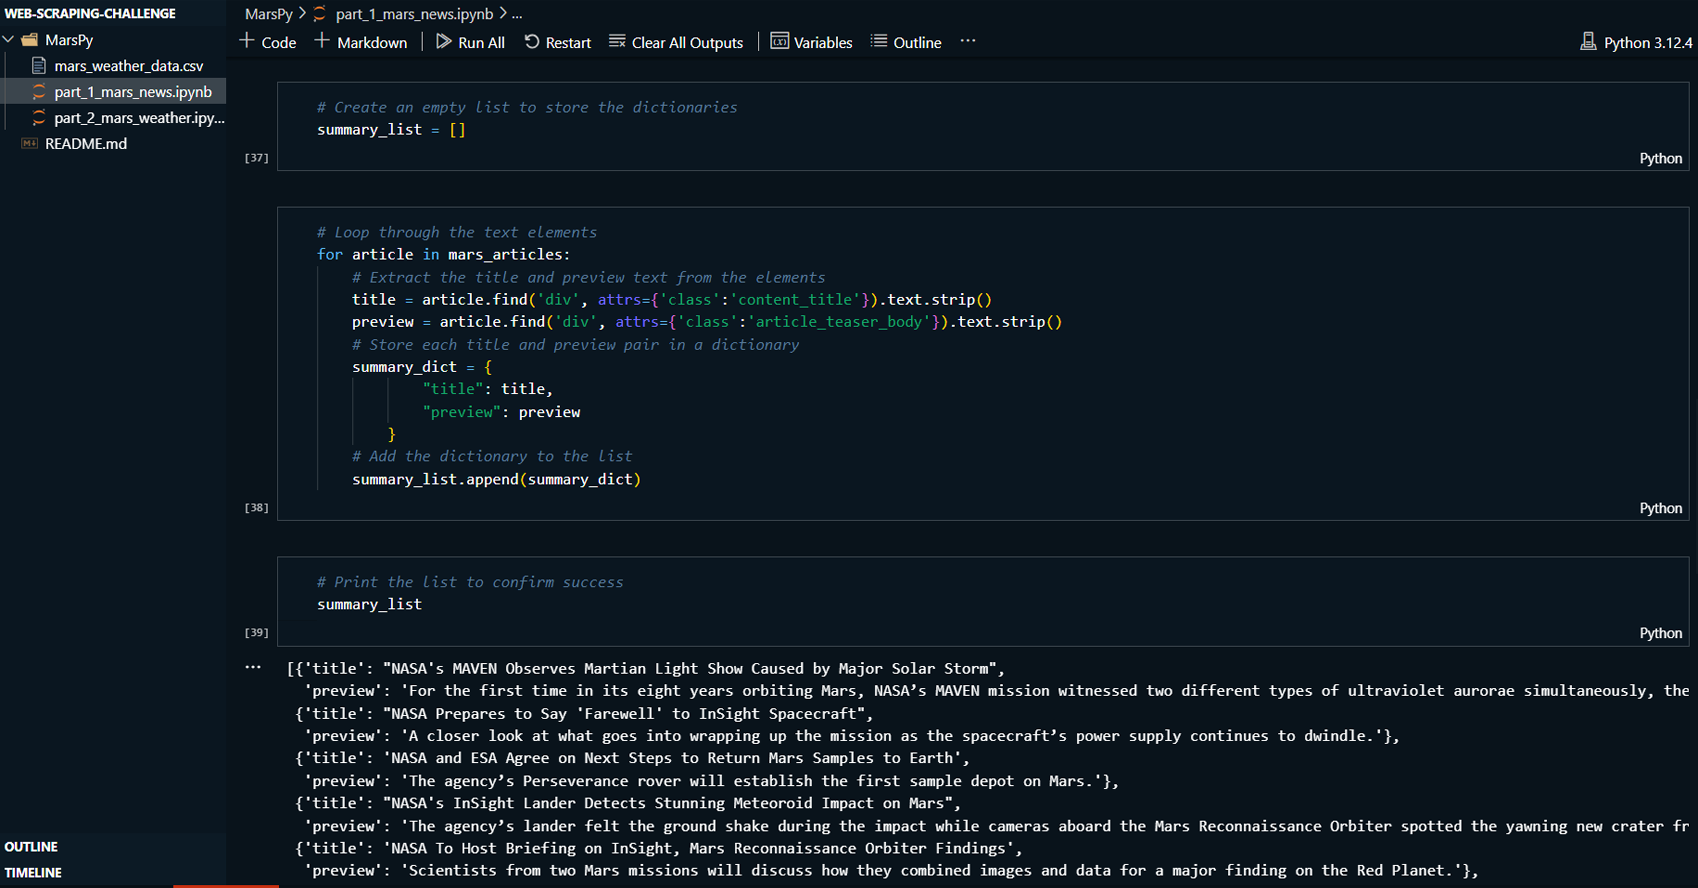
Extracted and stored the scraped data into Python
dictionaries for Mars news and into a Pandas
DataFrame for Mars weather data.
-
Printed and verified the scraping results, ensuring
accuracy and completeness.
-
Data Processing & Analysis:
-
Processed Mars weather data by converting data types
(e.g., date, temperature, atmospheric pressure) to
their appropriate formats.
-
Performed data analysis using Pandas to identify
trends, such as which month on Mars has the lowest
temperature and the lowest atmospheric pressure.
-
Calculated the number of terrestrial days in a
Martian year based on the scraped weather data.
-
Data Visualization:
-
Created informative visualizations using Matplotlib:
-
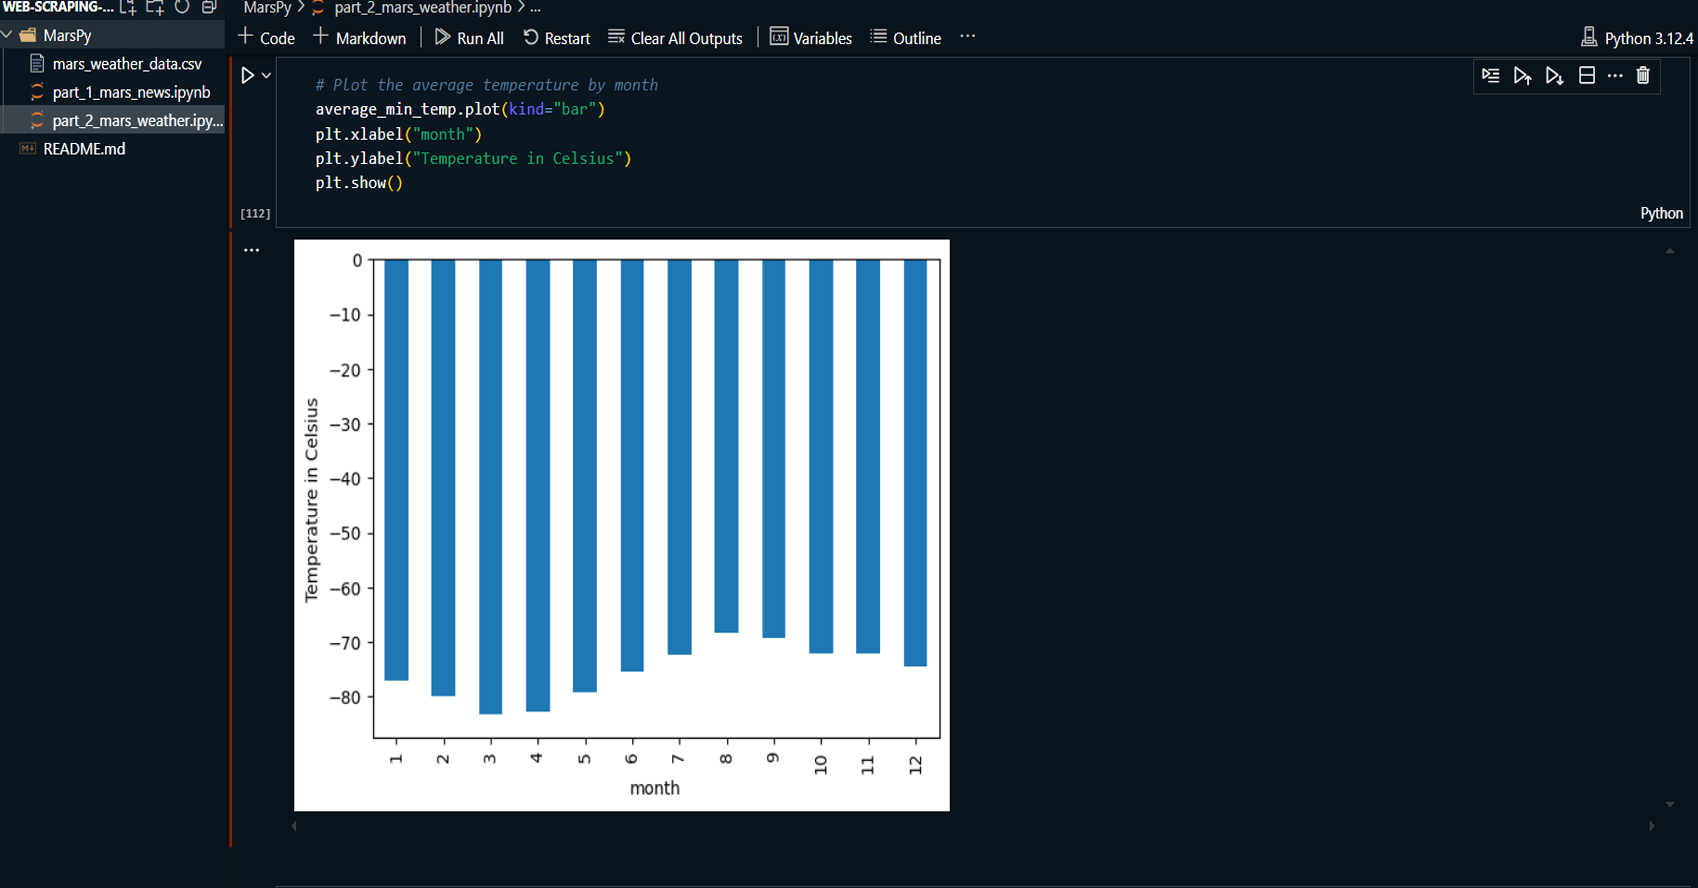
A line chart illustrating which month has the
lowest average temperature.
-
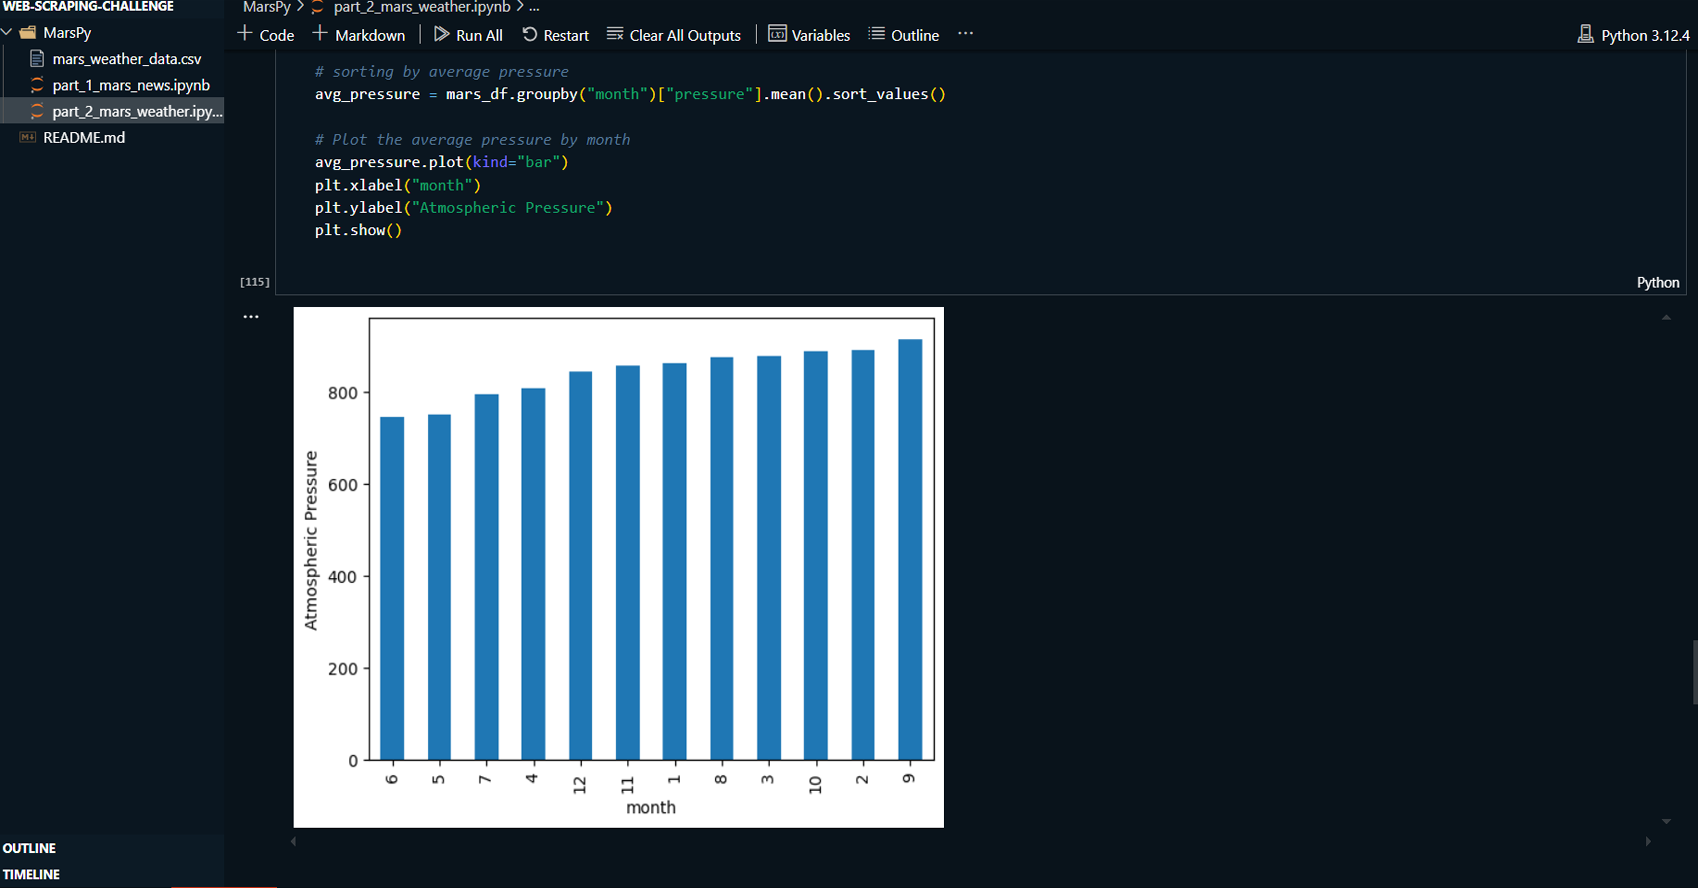
A bar chart showing the month with the lowest
atmospheric pressure.
-
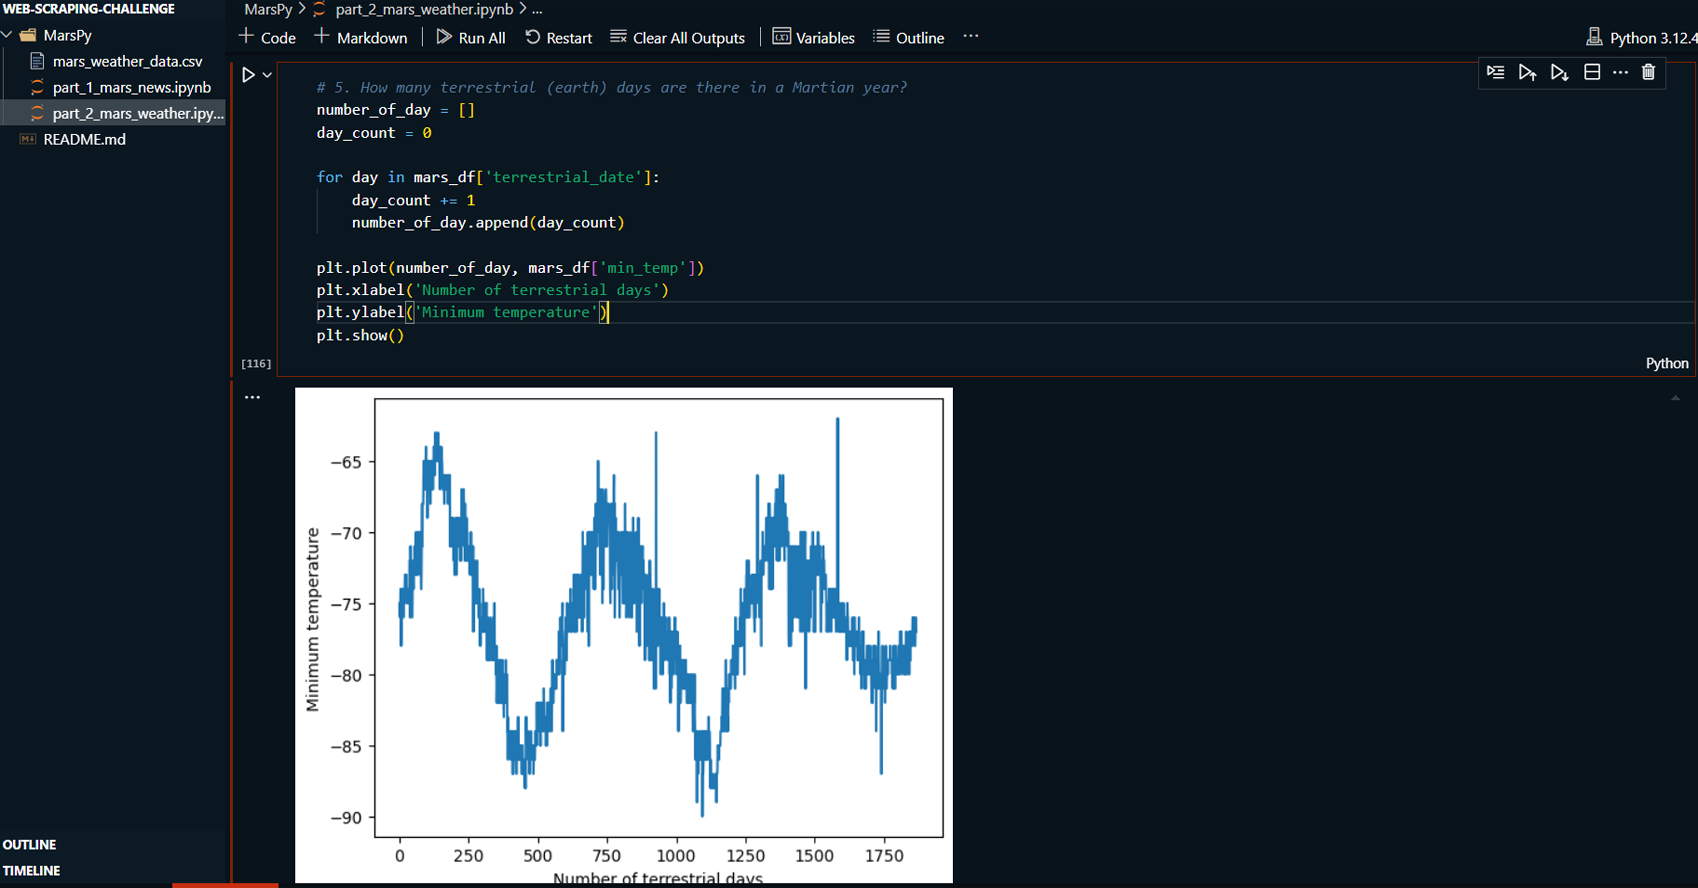
A visualization of the number of terrestrial
days in a Martian year.
-
Exporting Data:
-
Exported the cleaned Mars weather data to a CSV file
for future analysis or reporting purposes.
-
Documentation:
-
Documented the entire process within a Jupyter
Notebook, explaining each step, from web scraping
and data cleaning to analysis and visualization.
-
Provided clear and structured code with comments,
making it easy to follow and reproduce.
GitHub Link: To see my project on GitHub
please click GitHub Repository button below
Project Summary:
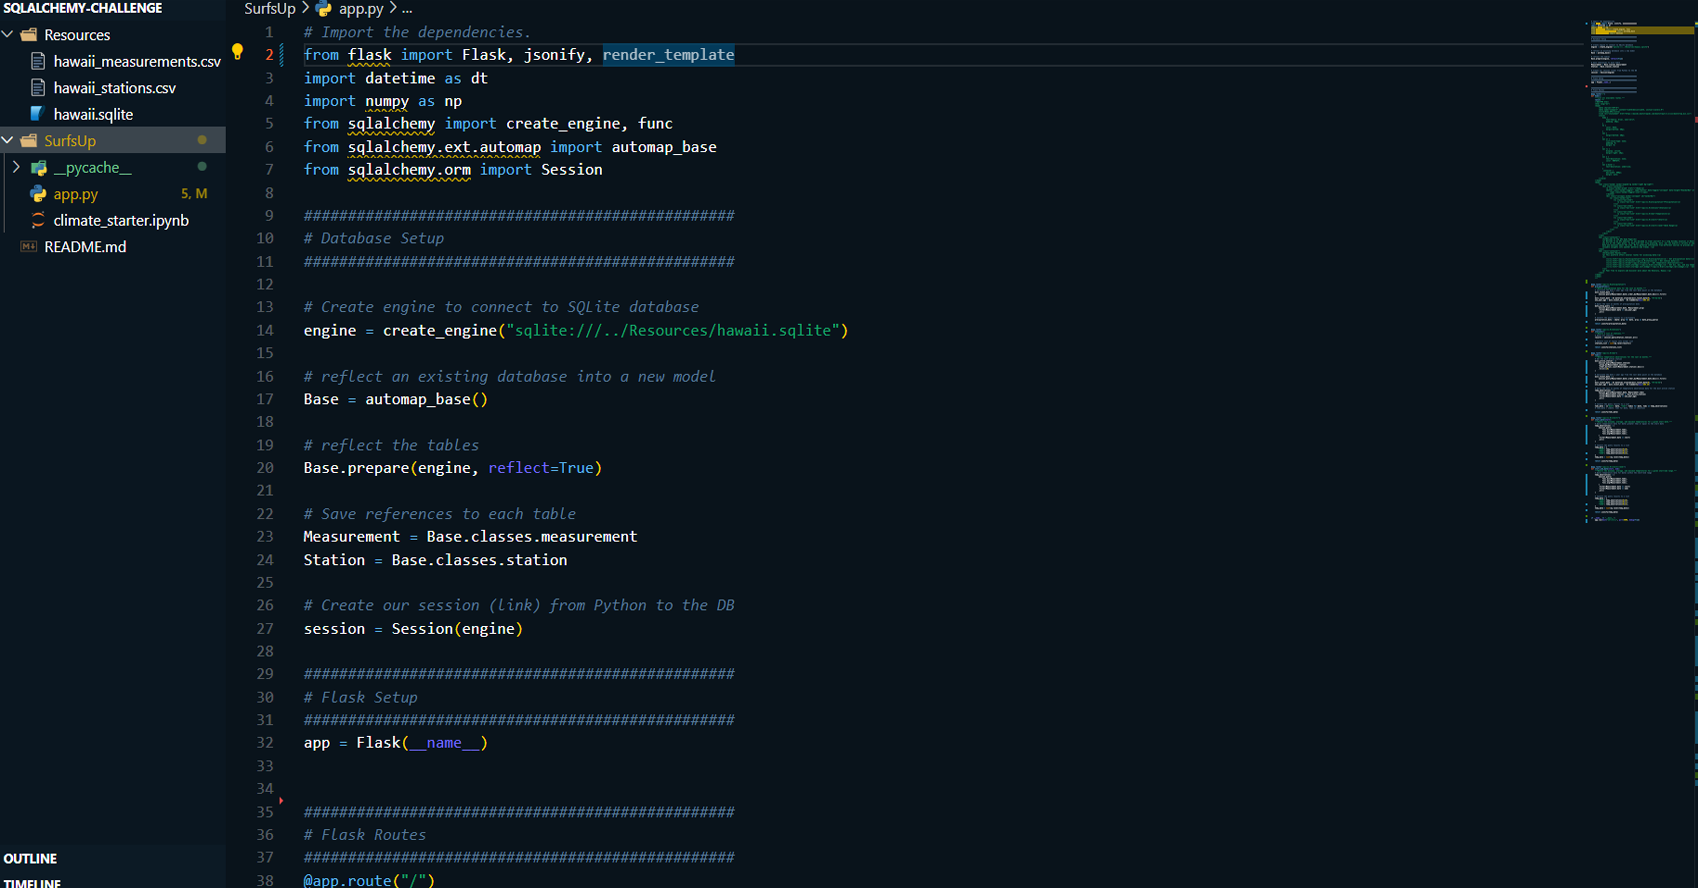
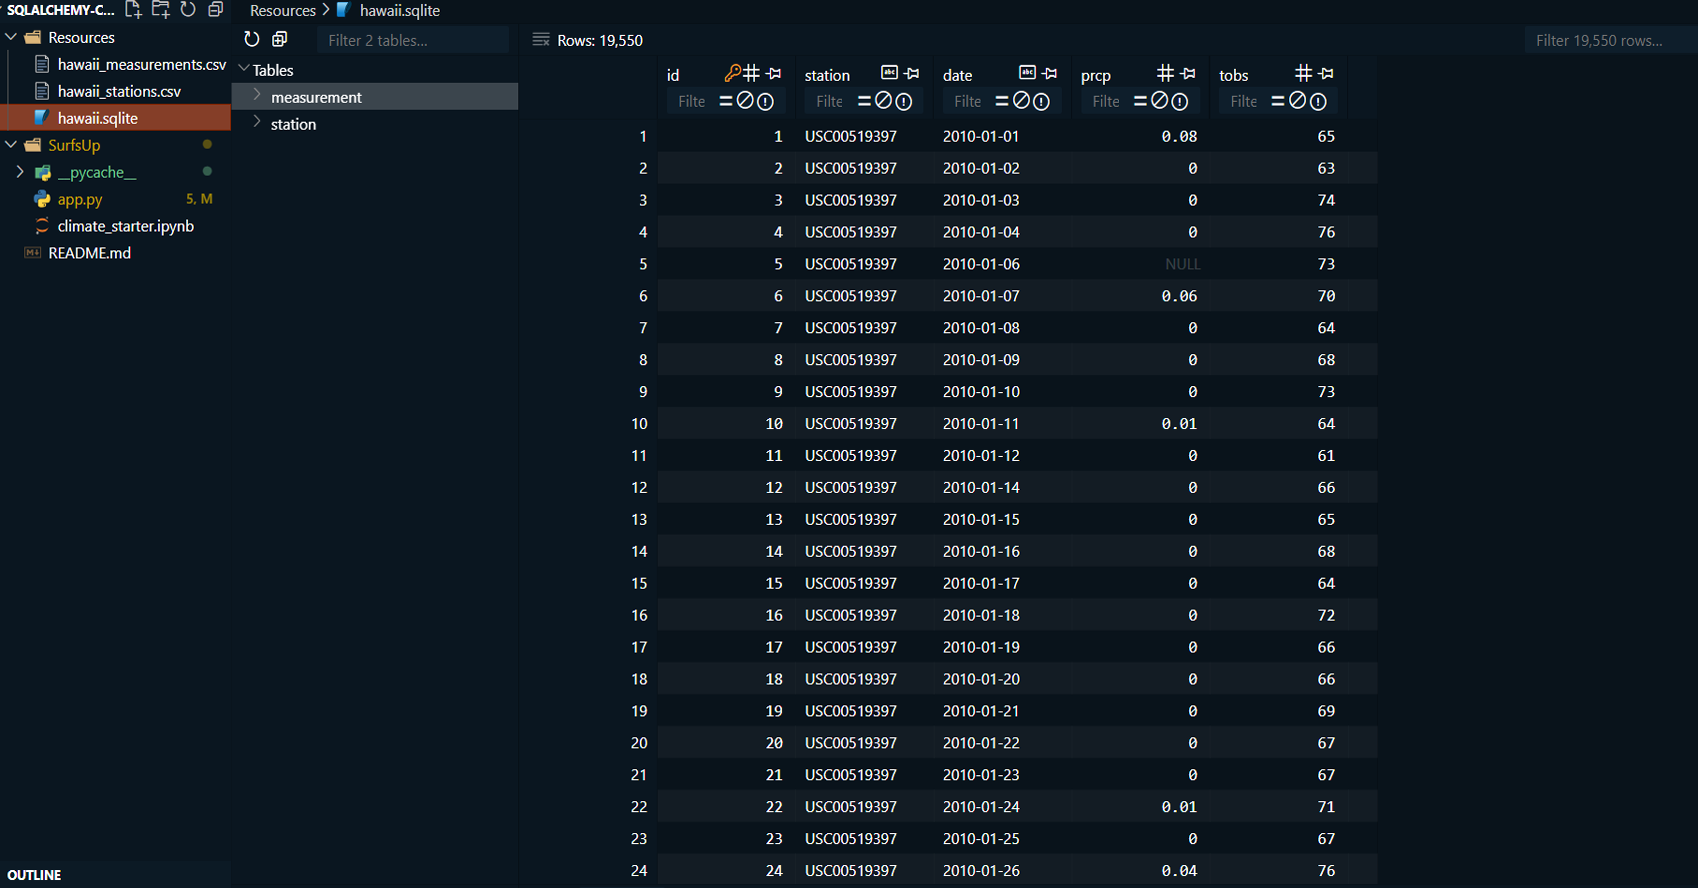
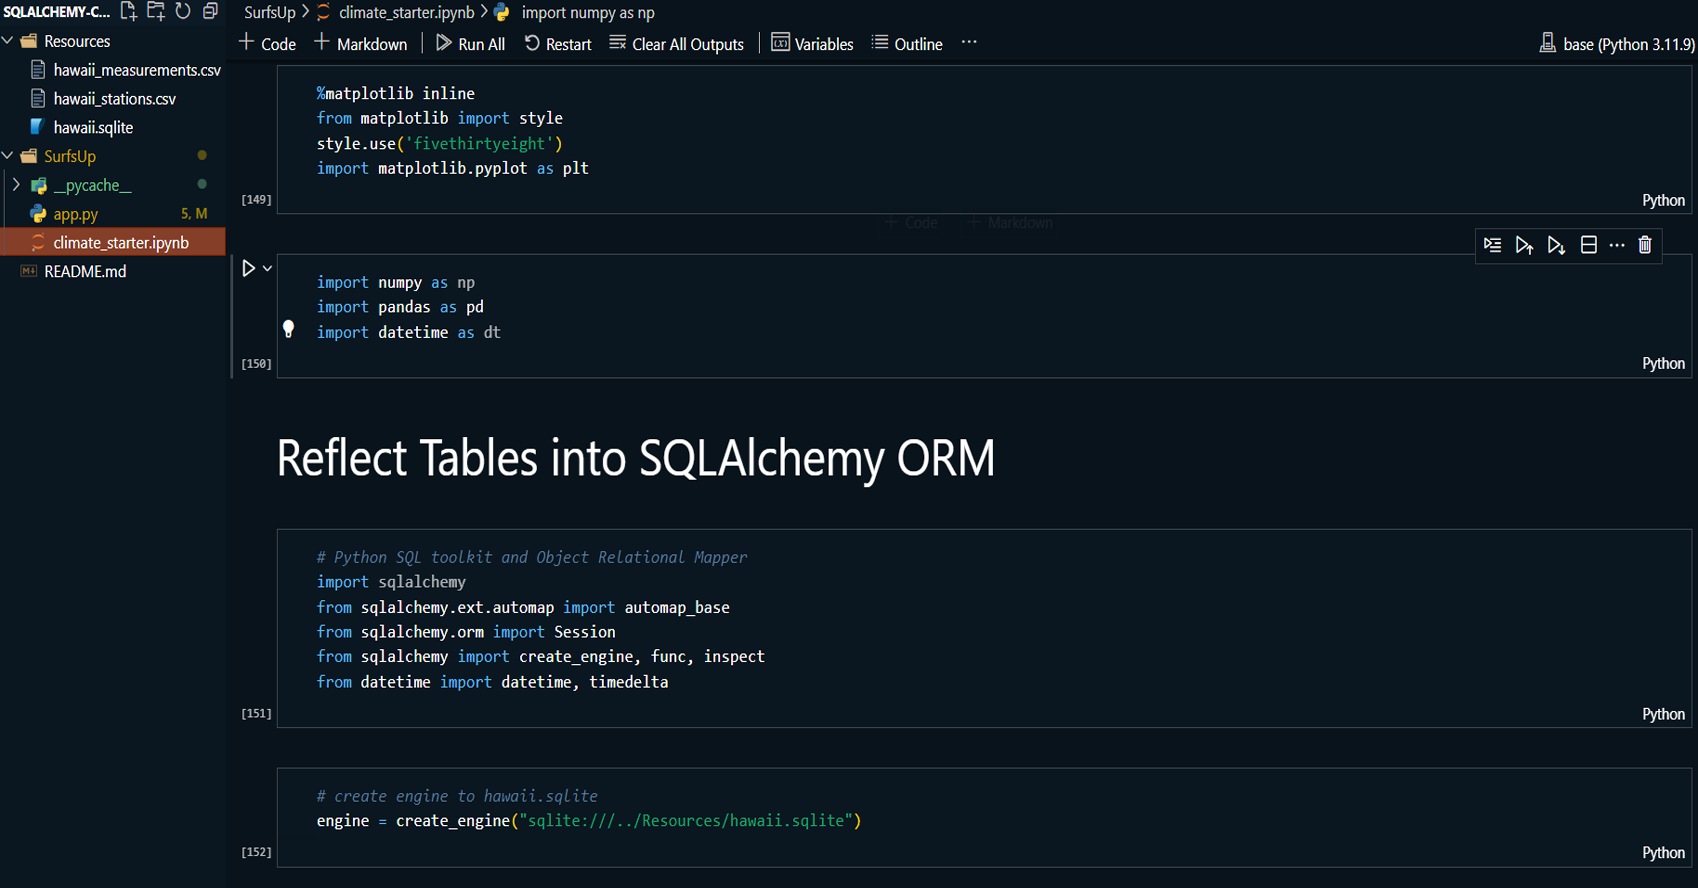
This project involves using SQLAlchemy to analyze climate
data stored in a SQLite database, followed by the design of
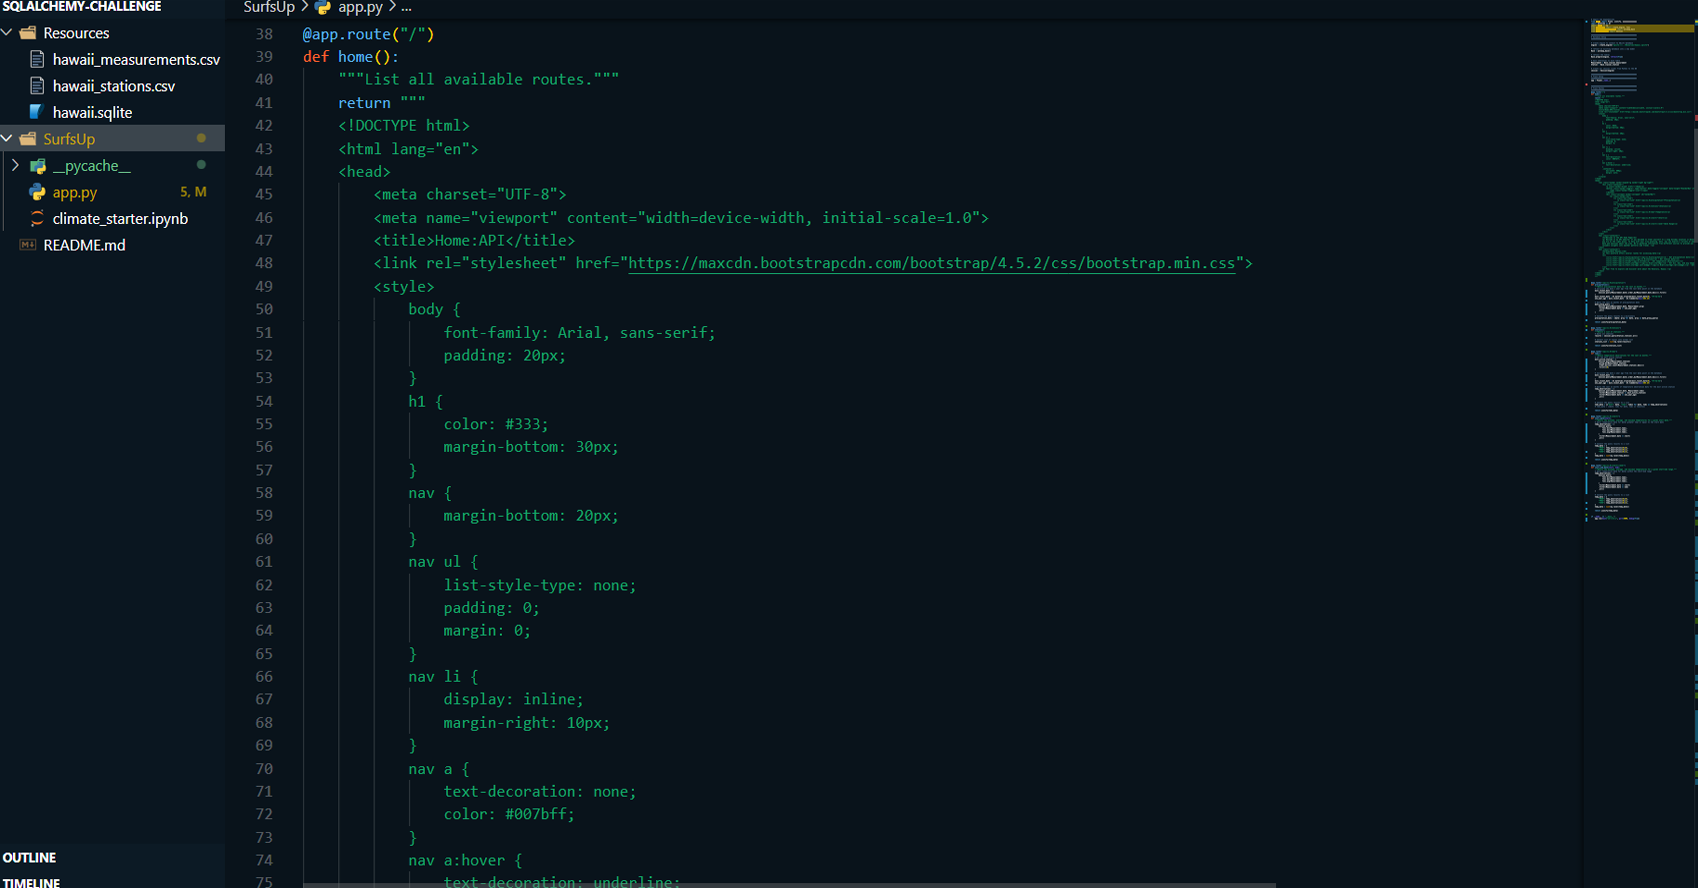
a Flask API to make the analysis accessible through
web-based routes. The analysis focuses on Hawaii’s weather,
including precipitation and temperature trends, with an
exploration of various weather stations across the region.
The project is divided into two parts: the first part
analyzes and explores climate data using Python, SQLAlchemy,
and Pandas, while the second part develops a Flask API to
serve the analysis results through different endpoints.
Read More
Technologies:
-
Python: For scripting and analysis.
-
SQLAlchemy: For connecting to the
SQLite database and running SQL queries within Python.
-
SQLite: For storing and querying the climate data.
-
Flask: For designing and building a RESTful API to expose the data.
-
Pandas: For data manipulation and analysis.
-
Matplotlib: For visualizing the climate data.
Highlighted Skills:
-
Database Connection and Analysis:
-
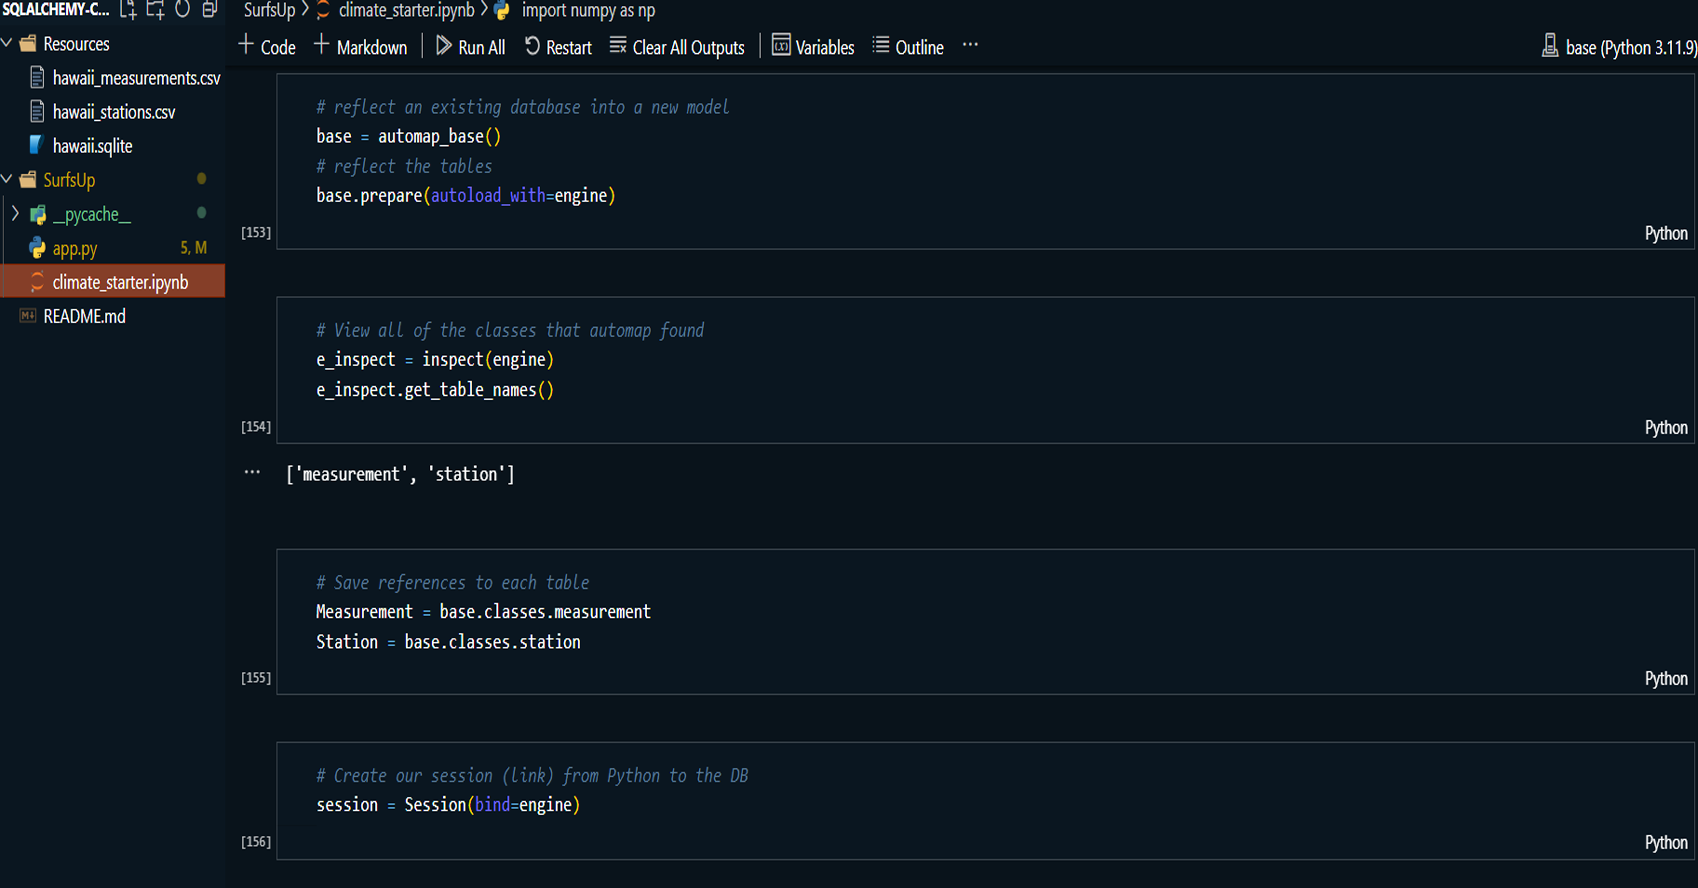
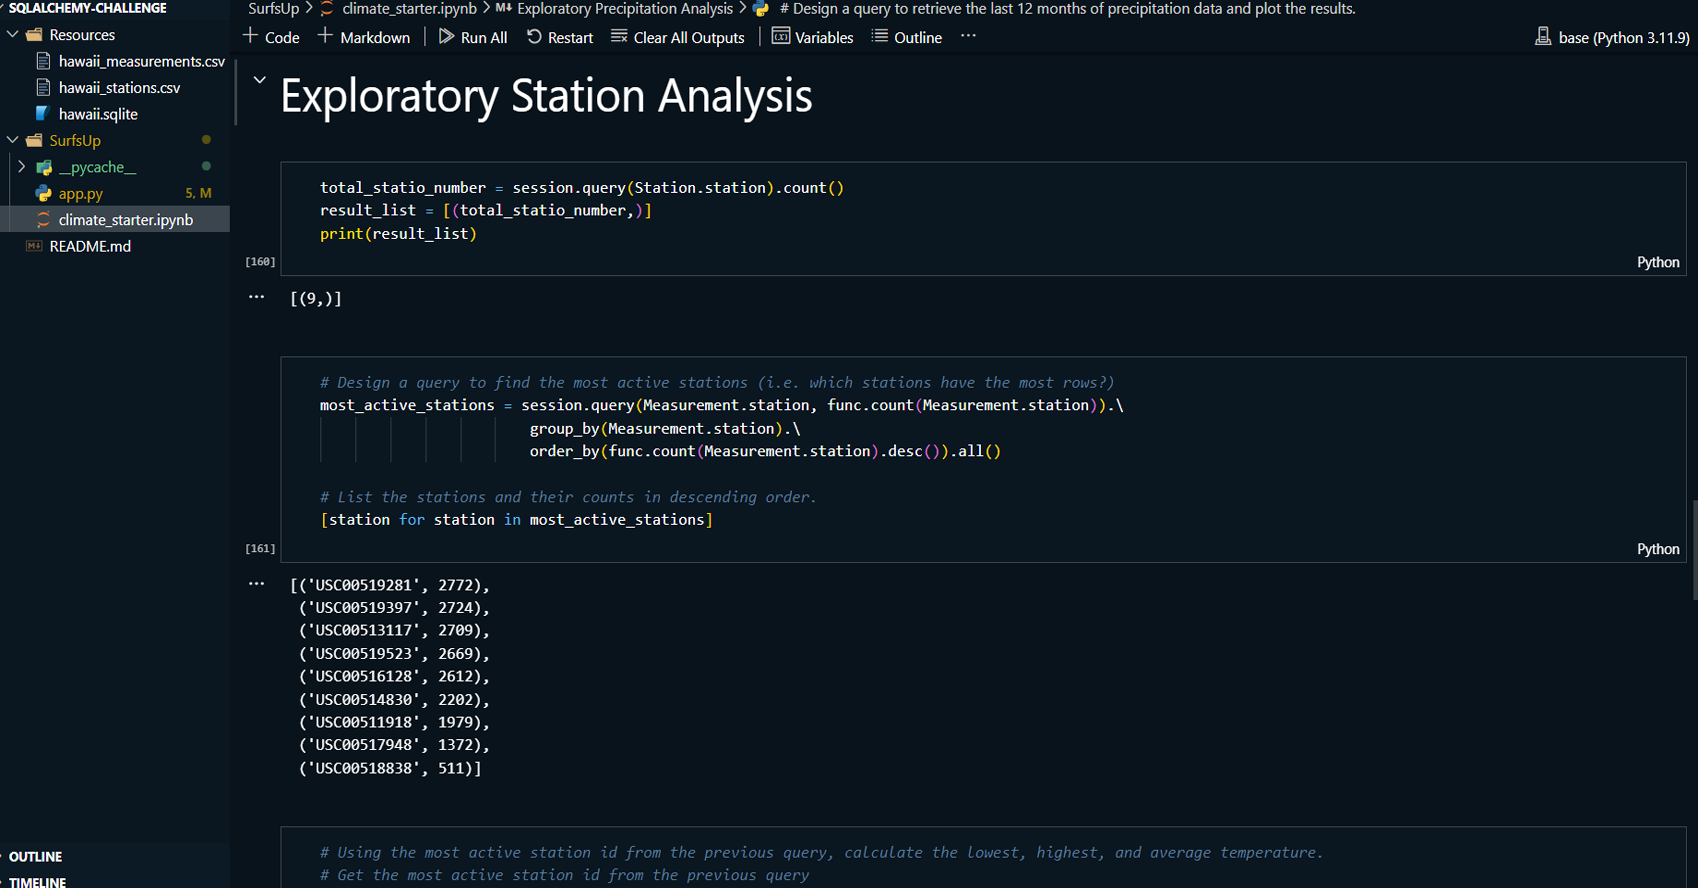
Connected to the SQLite database using SQLAlchemy and explored the tables using SQL queries.
-
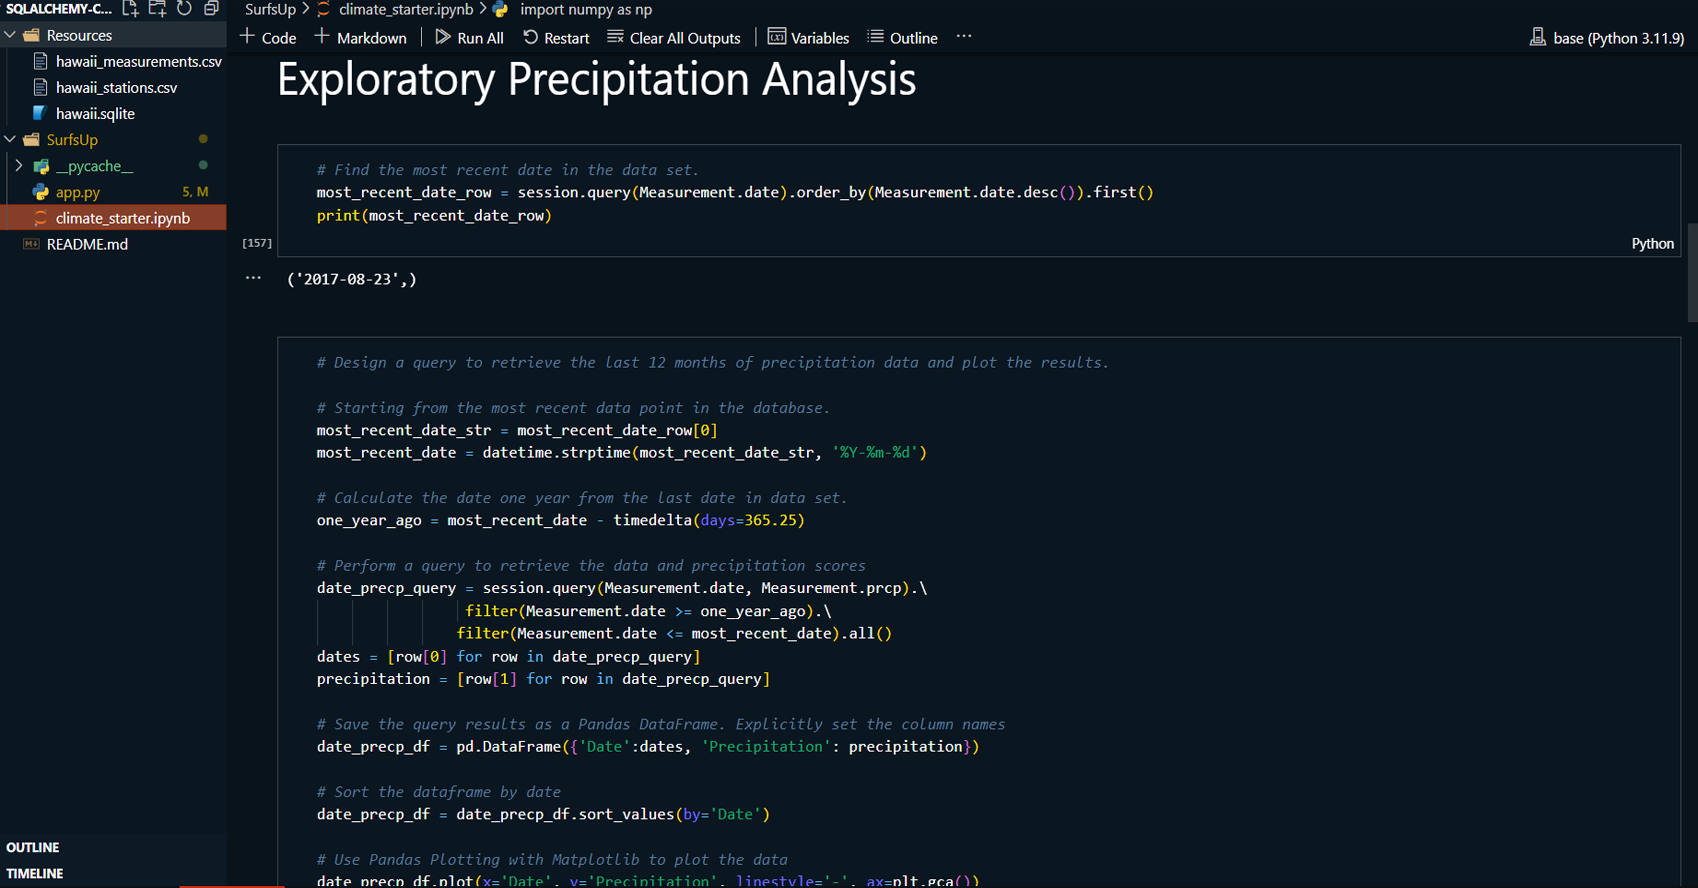
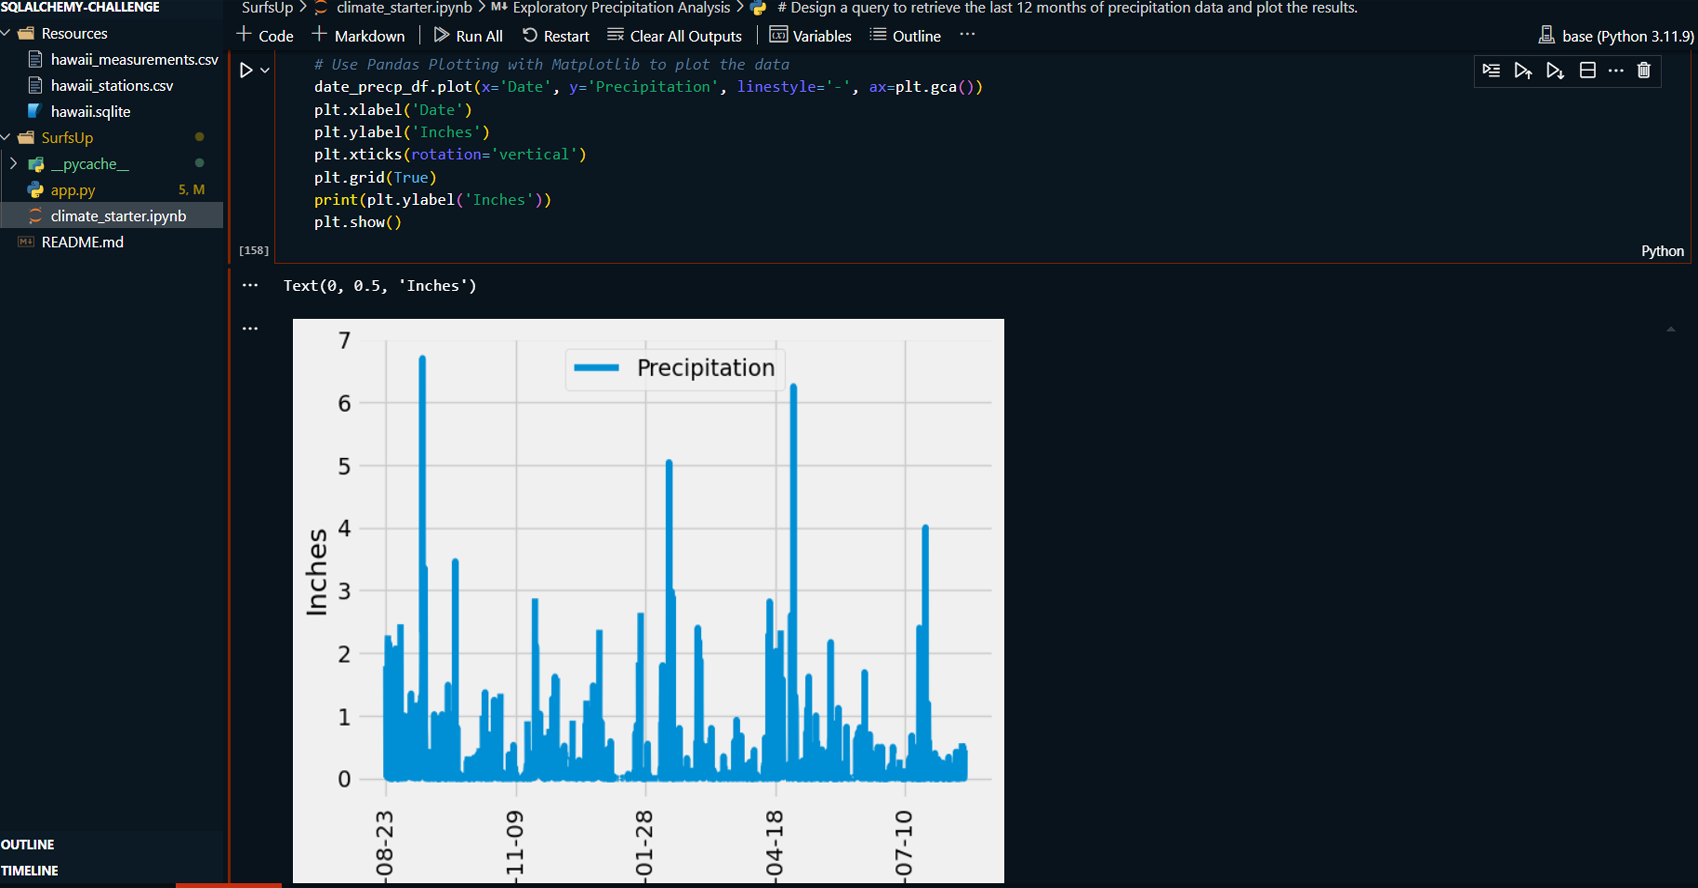
Extracted the most recent date from the climate data and queried the past 12 months of precipitation data.
-
Loaded the precipitation data into Pandas DataFrames for sorting and analysis, followed by visualizing the results in a bar chart using Matplotlib.
-
Conducted station analysis to identify the most active weather station based on observation counts.
-
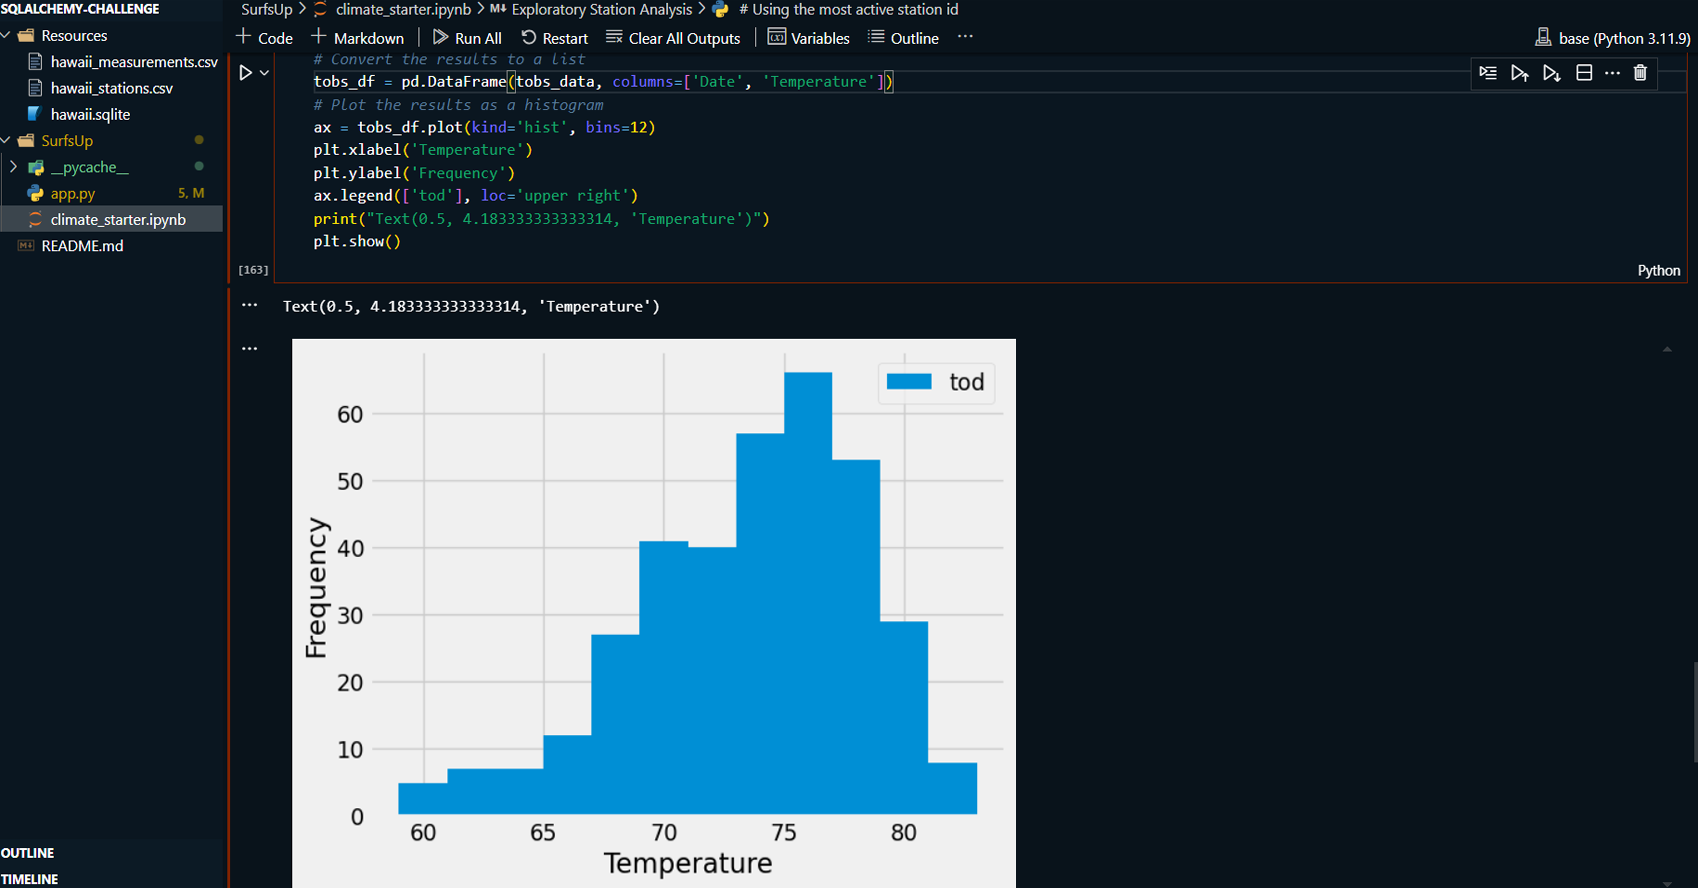
Queried and visualized the temperature observations (tobs) for the most active station using a histogram.
-
Flask API Development:
- Designed a Flask API to expose climate data analysis results through several endpoints.
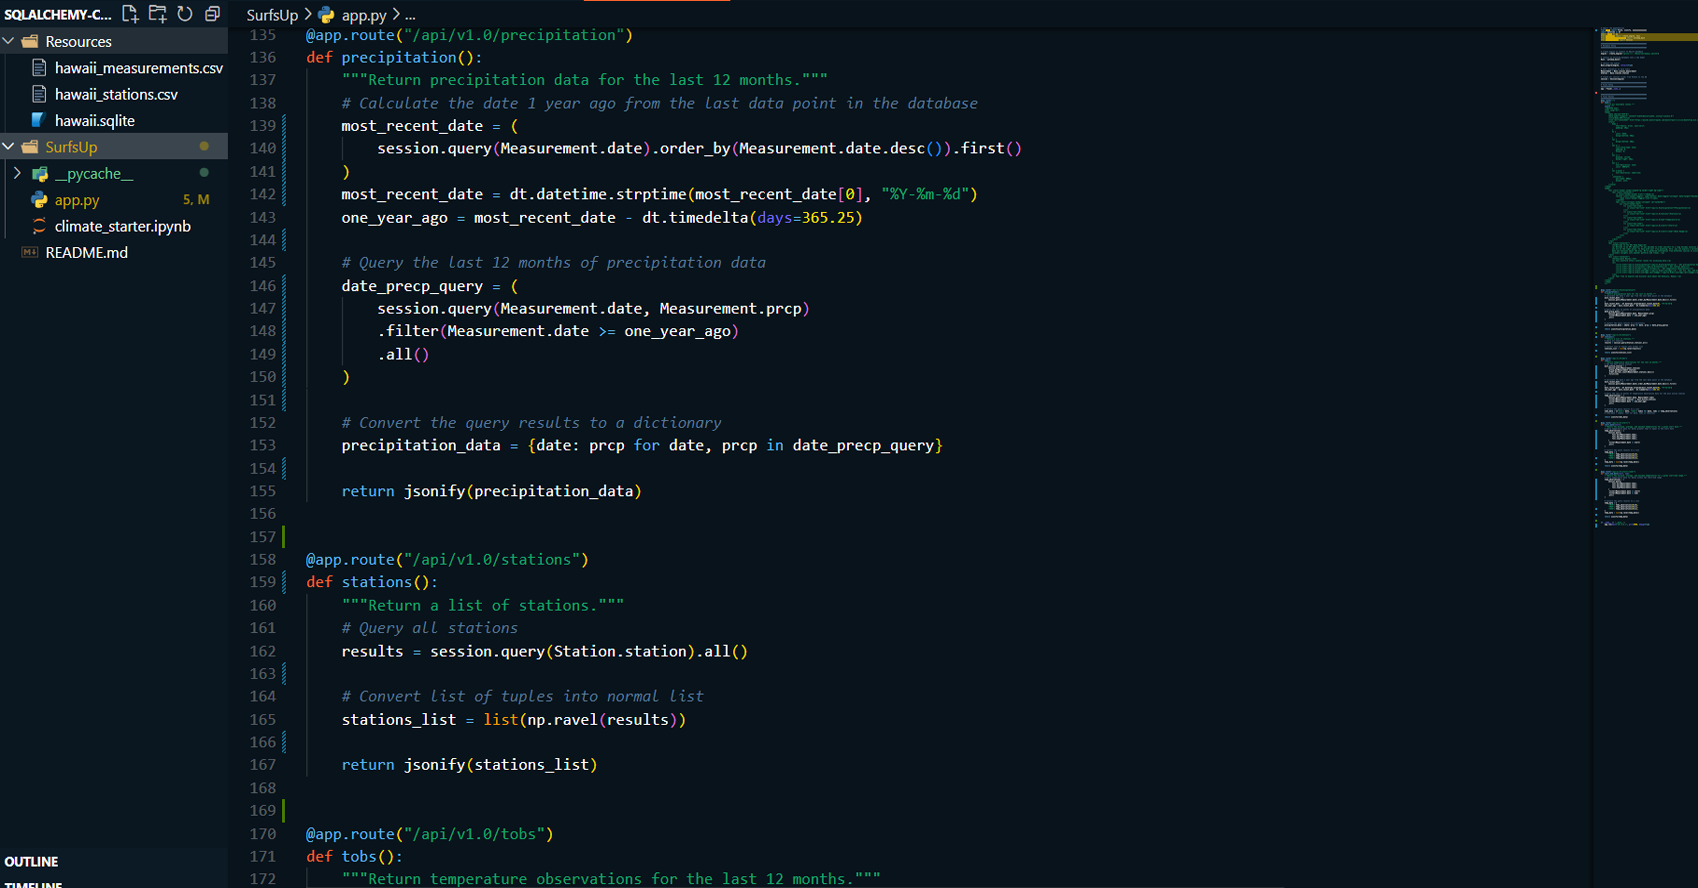
- Created routes to serve precipitation data, list of weather stations, temperature observations, and statistics (min, max, avg) for user-specified date ranges.
-
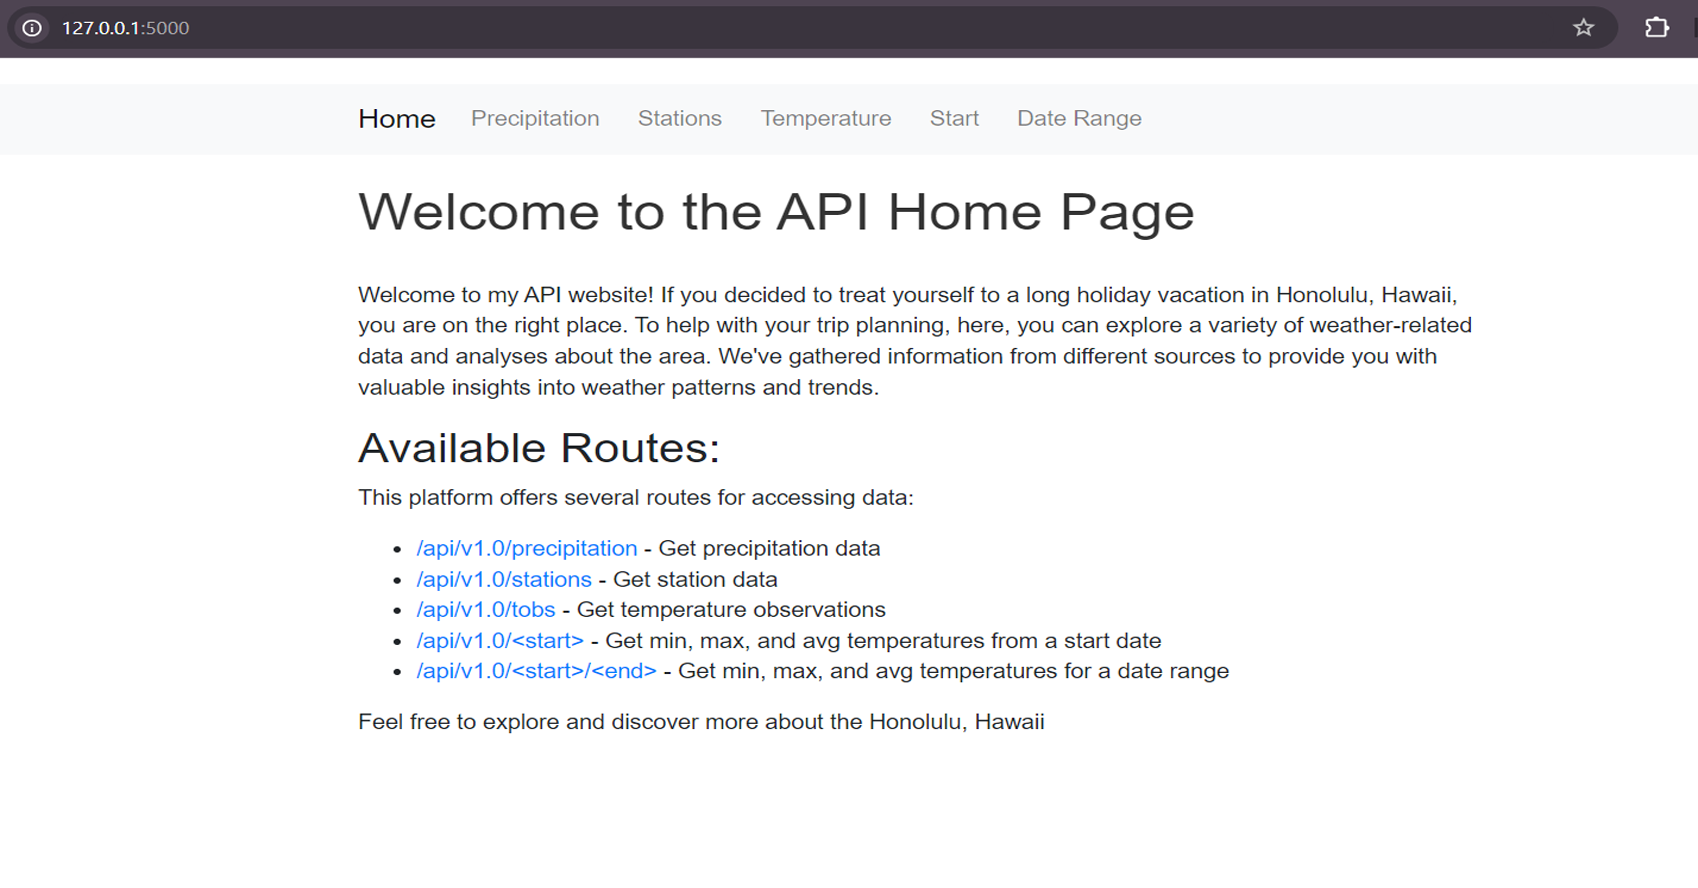
Implemented the following routes in the Flask application:
-
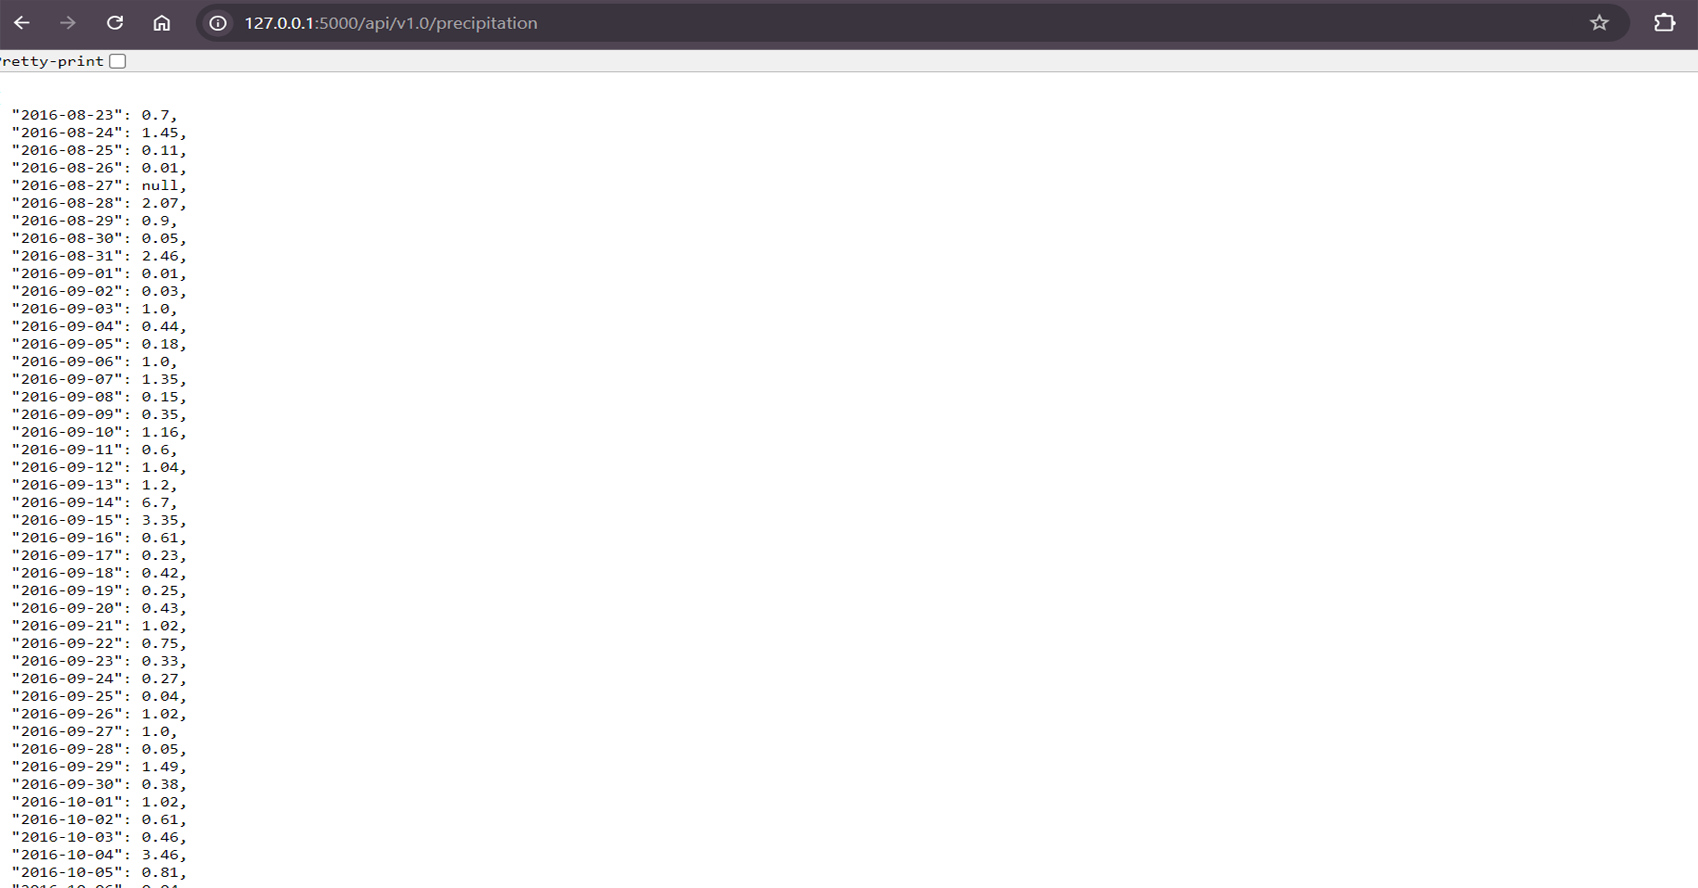
/api/v1.0/precipitation: Returns precipitation data for the last 12 months.
-
/api/v1.0/stations: Returns a JSON list of weather stations.
-
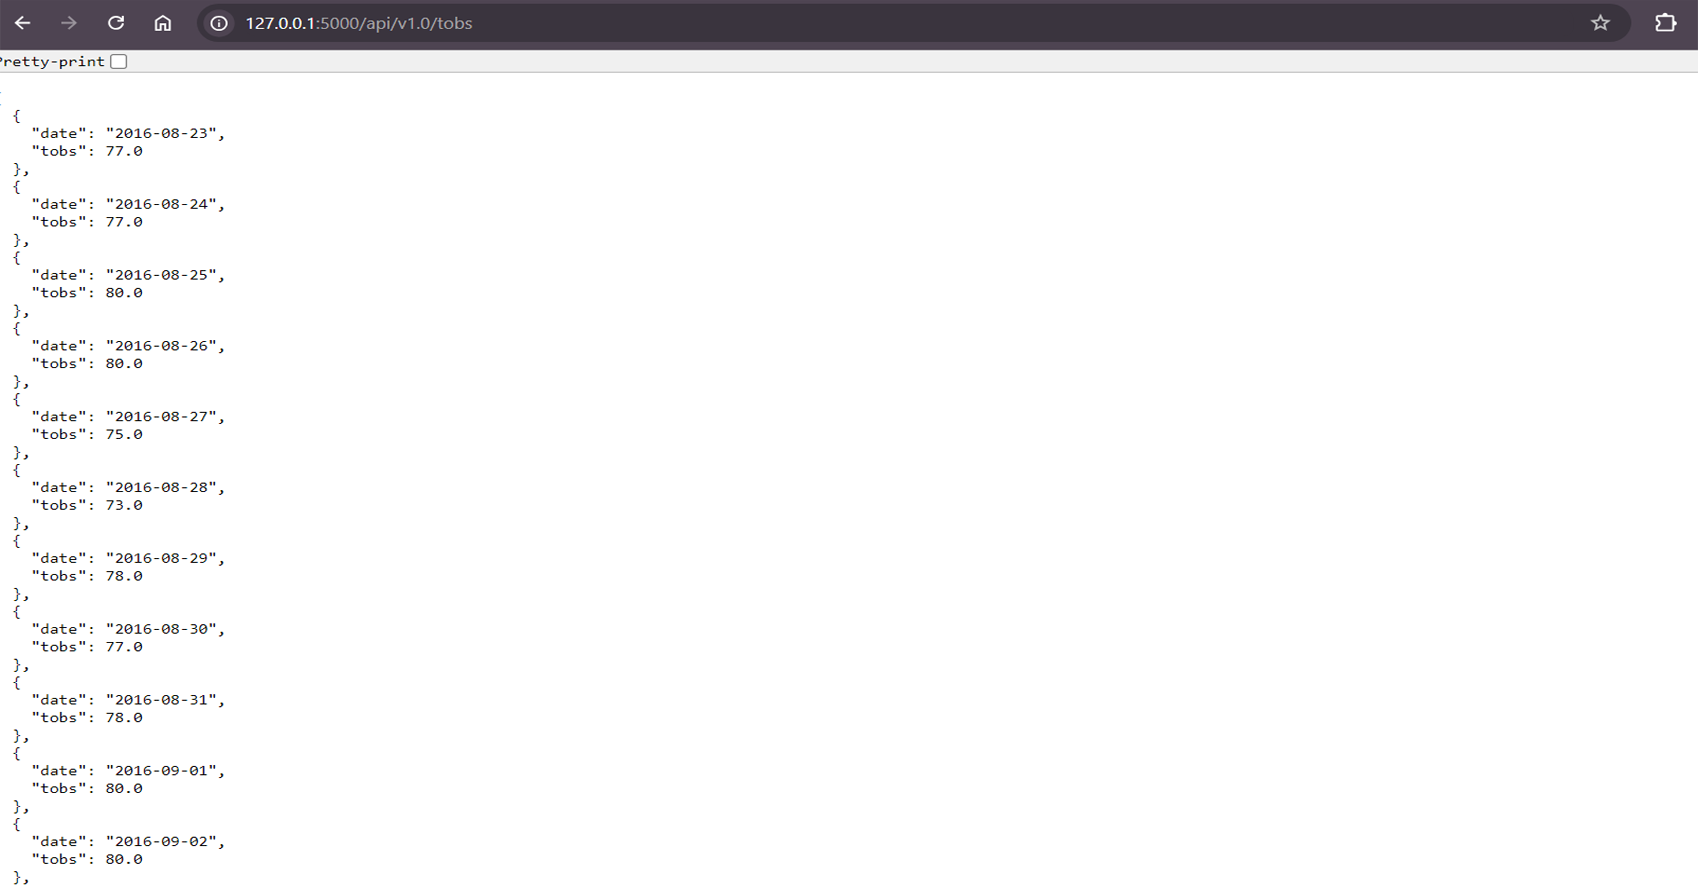
/api/v1.0/tobs: Returns temperature observations for the most active station.
-
/api/v1.0/: Returns minimum, maximum, and average temperature for a specified start date.
-
/api/v1.0//: Returns temperature statistics for a given date range.
-
Data Processing and Visualization:
-
Processed the data into easy-to-analyze formats using Pandas and visualized it with Matplotlib, generating clear insights into Hawaii’s climate patterns.
-
Performed exploratory data analysis (EDA) to derive key insights, such as precipitation patterns and temperature trends.
-
Documentation:
-
Documented all analysis, data processing steps, and Flask API creation within a Jupyter Notebook.
-
Provided code comments and detailed explanations for each step of the project, making it easy for others to understand the methodology.
GitHub Link: To see my project on GitHub
please click GitHub Repository button below
Project Summary:
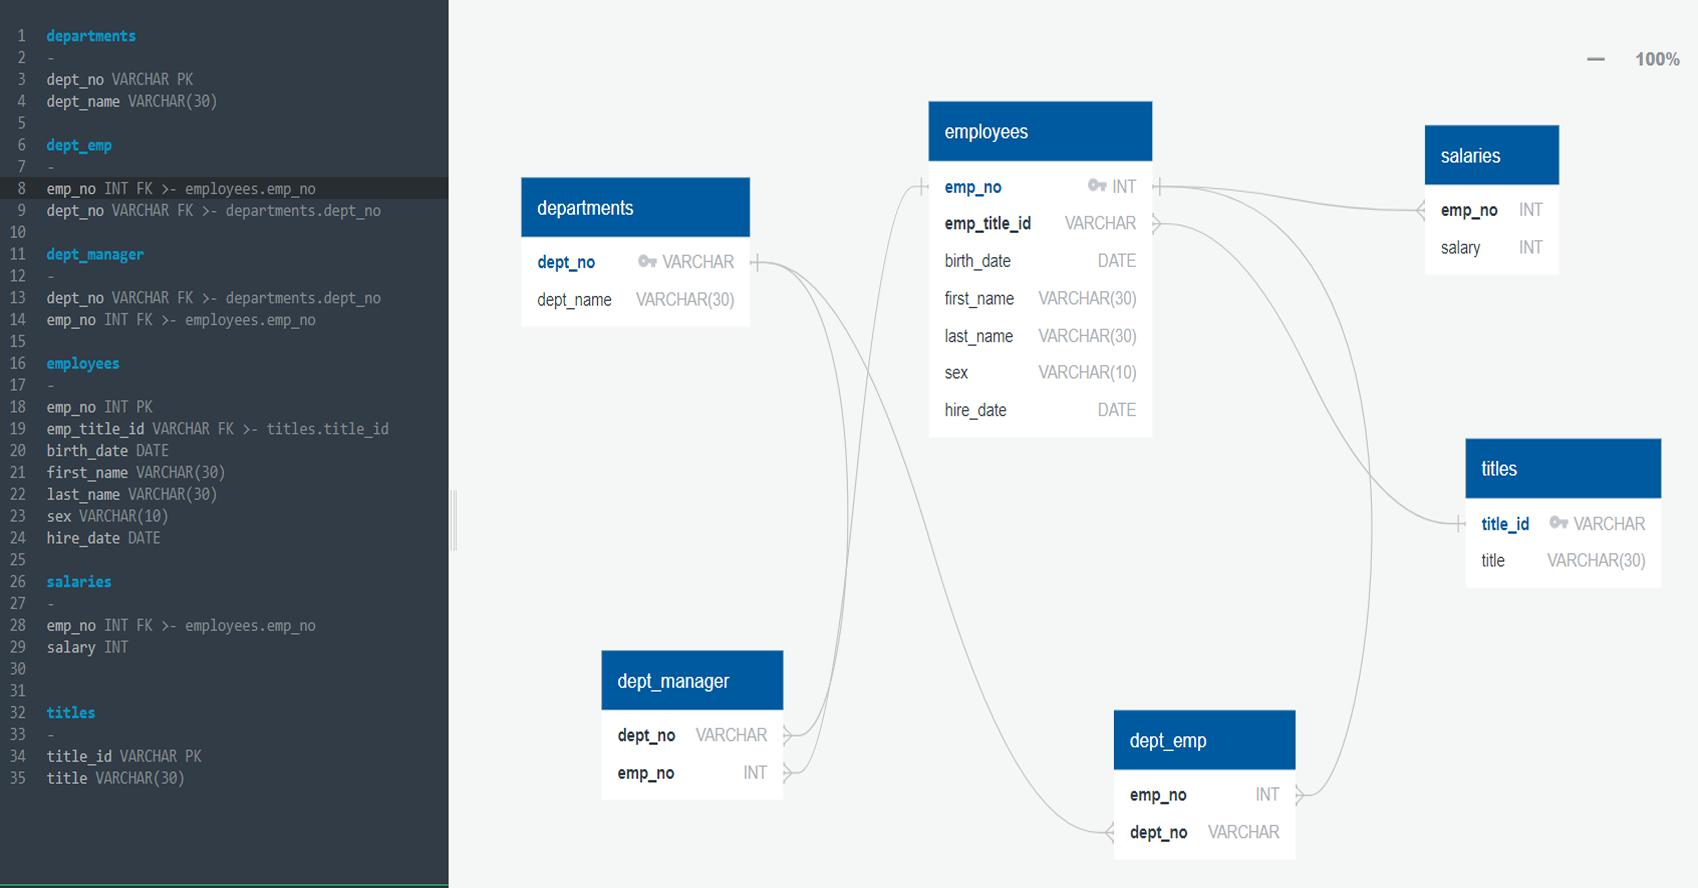
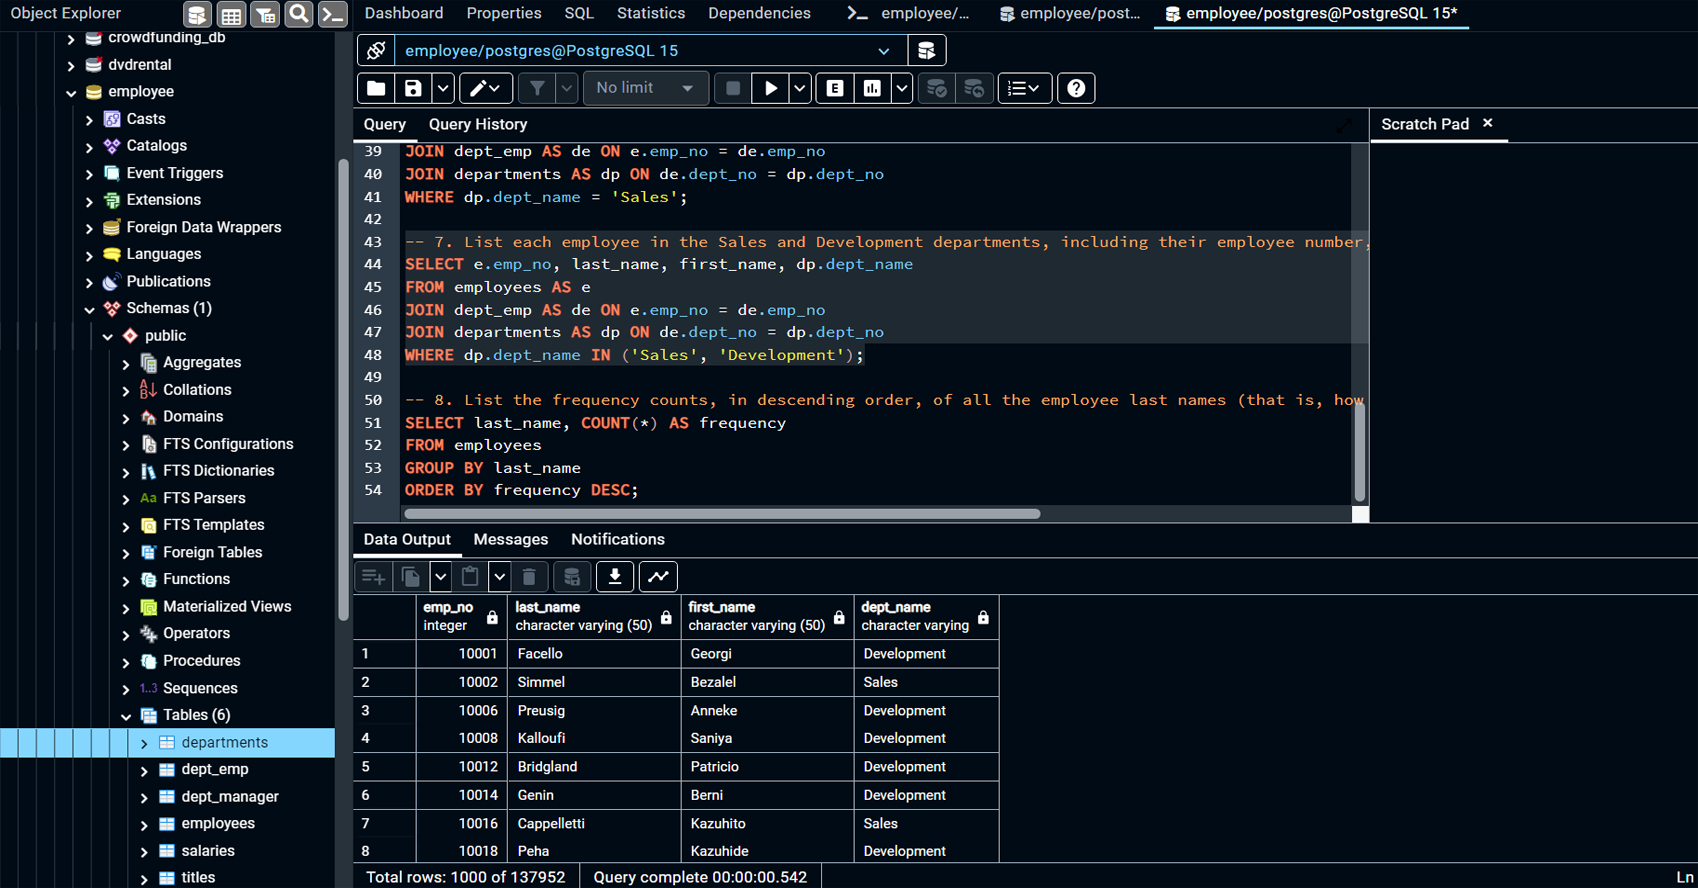
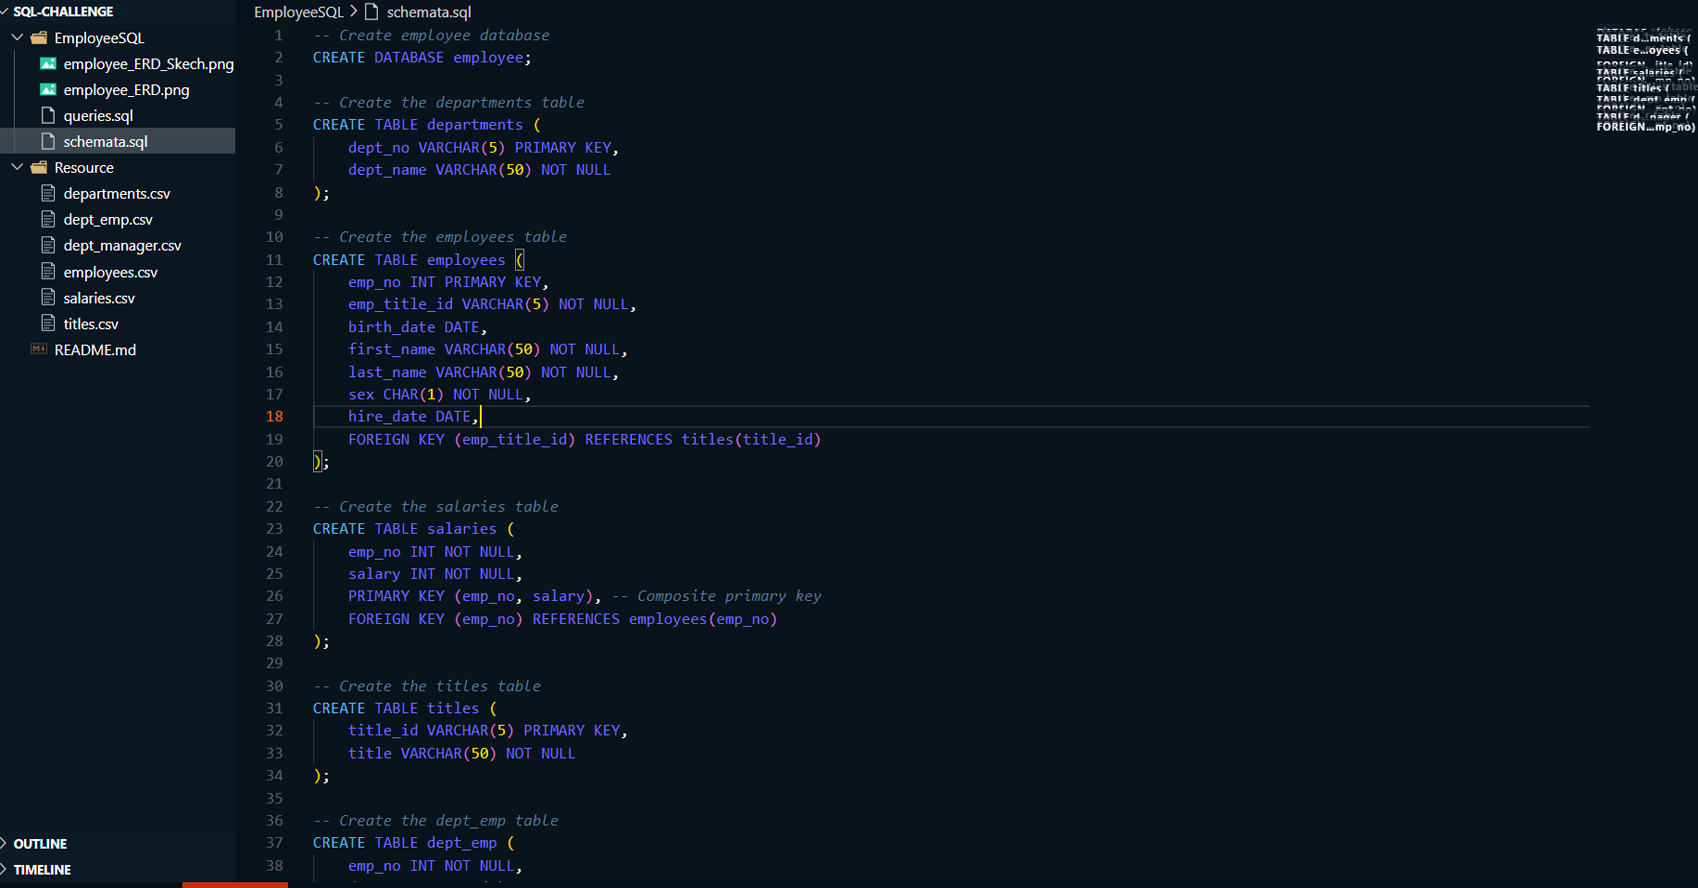
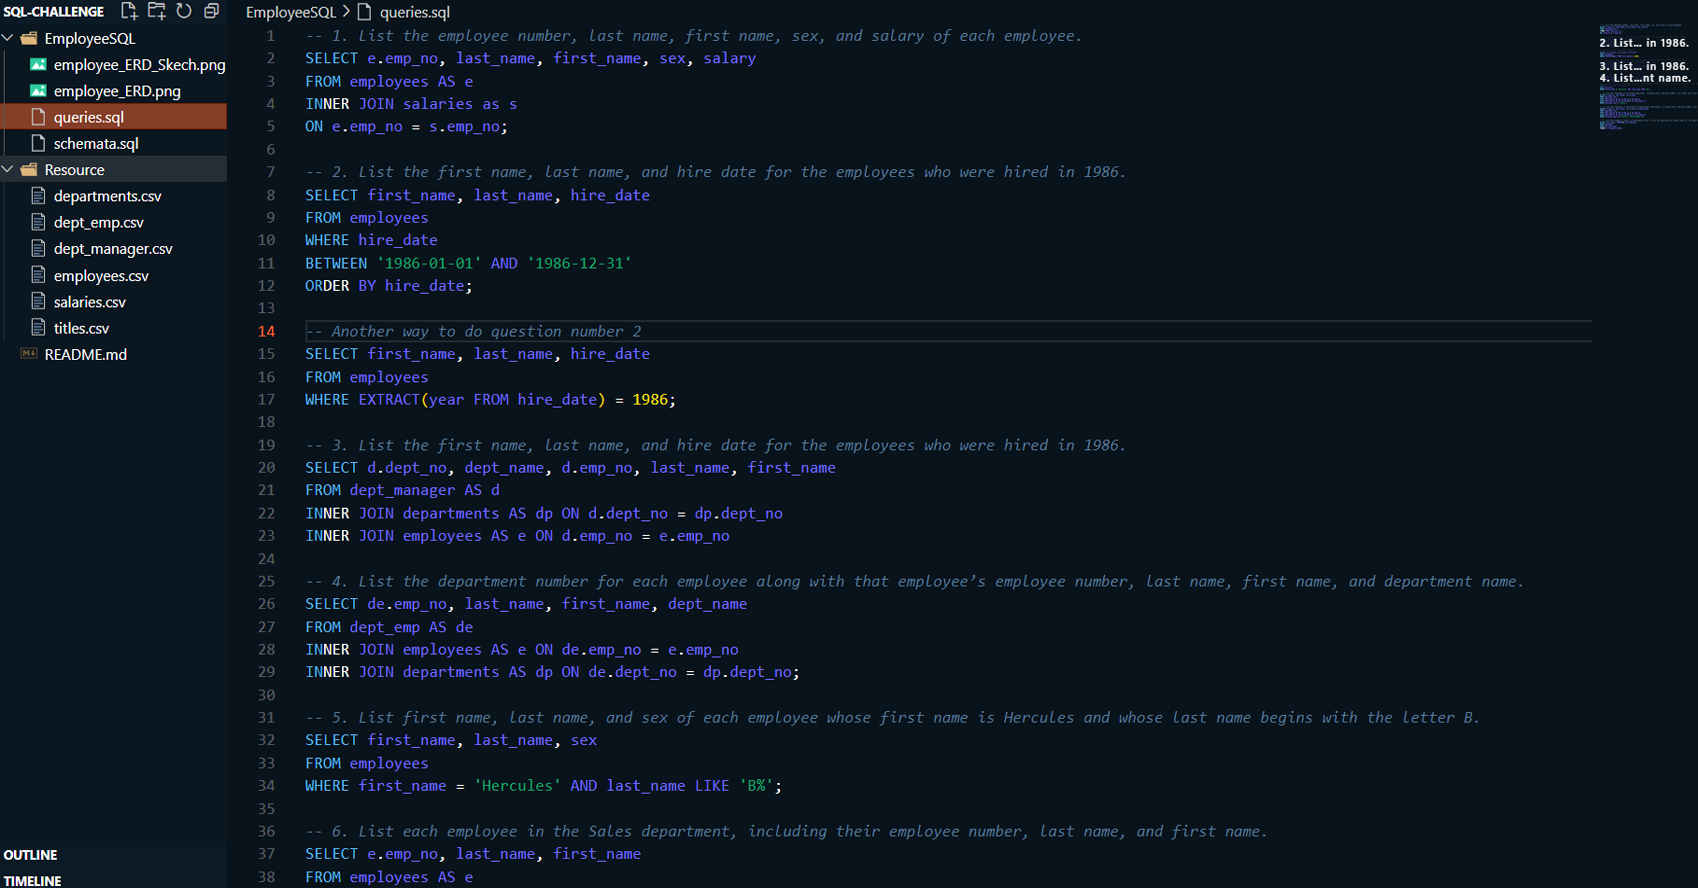
This project focuses on designing and engineering a relational database system for employee data, using SQL to query, analyze, and derive insights from the data. The project includes three key phases: Data Modeling, Data Engineering, and Data Analysis. In the Data Modeling phase, an Entity Relationship Diagram (ERD) is created to model the data structure. The Data Engineering phase involves creating and populating relational tables using PostgreSQL. Finally, in the Data Analysis phase, complex SQL queries are executed to analyze employee demographics, department structure, salary trends, and more.
Read More
Technologies:
-
PostgreSQL: For database creation, data modeling, and queries.
-
SQL: For data manipulation and analysis.
-
QuickDBD:: For sketching the Entity Relationship Diagram (ERD).
Highlighted Skills:
-
Data Modeling:
-
Analyzed the provided CSV files to design the database structure.
-
Created the initial Entity Relationship Diagram (ERD) using QuickDBD, which outlines the relationships between tables like employees, departments, titles, salaries, dept_emp, and dept_manager.
-
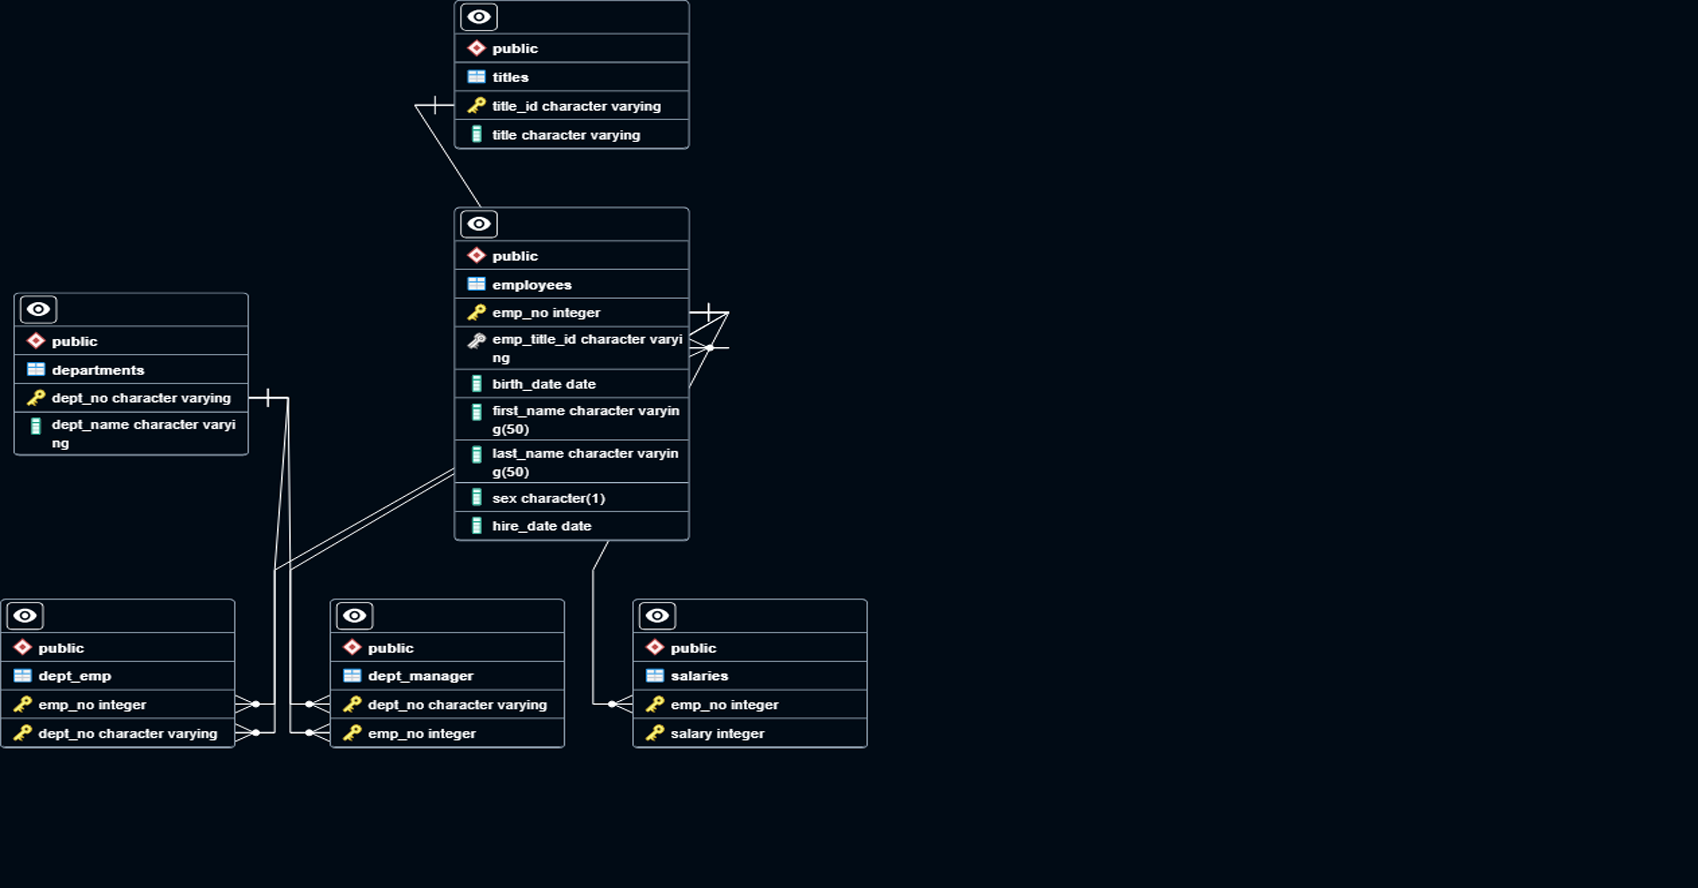
Refined the ERD after creating and populating the tables in PostgreSQL to ensure accuracy and consistency in table relationships (primary and foreign keys).
-
Data Engineering:
-
Creating Tables:
-
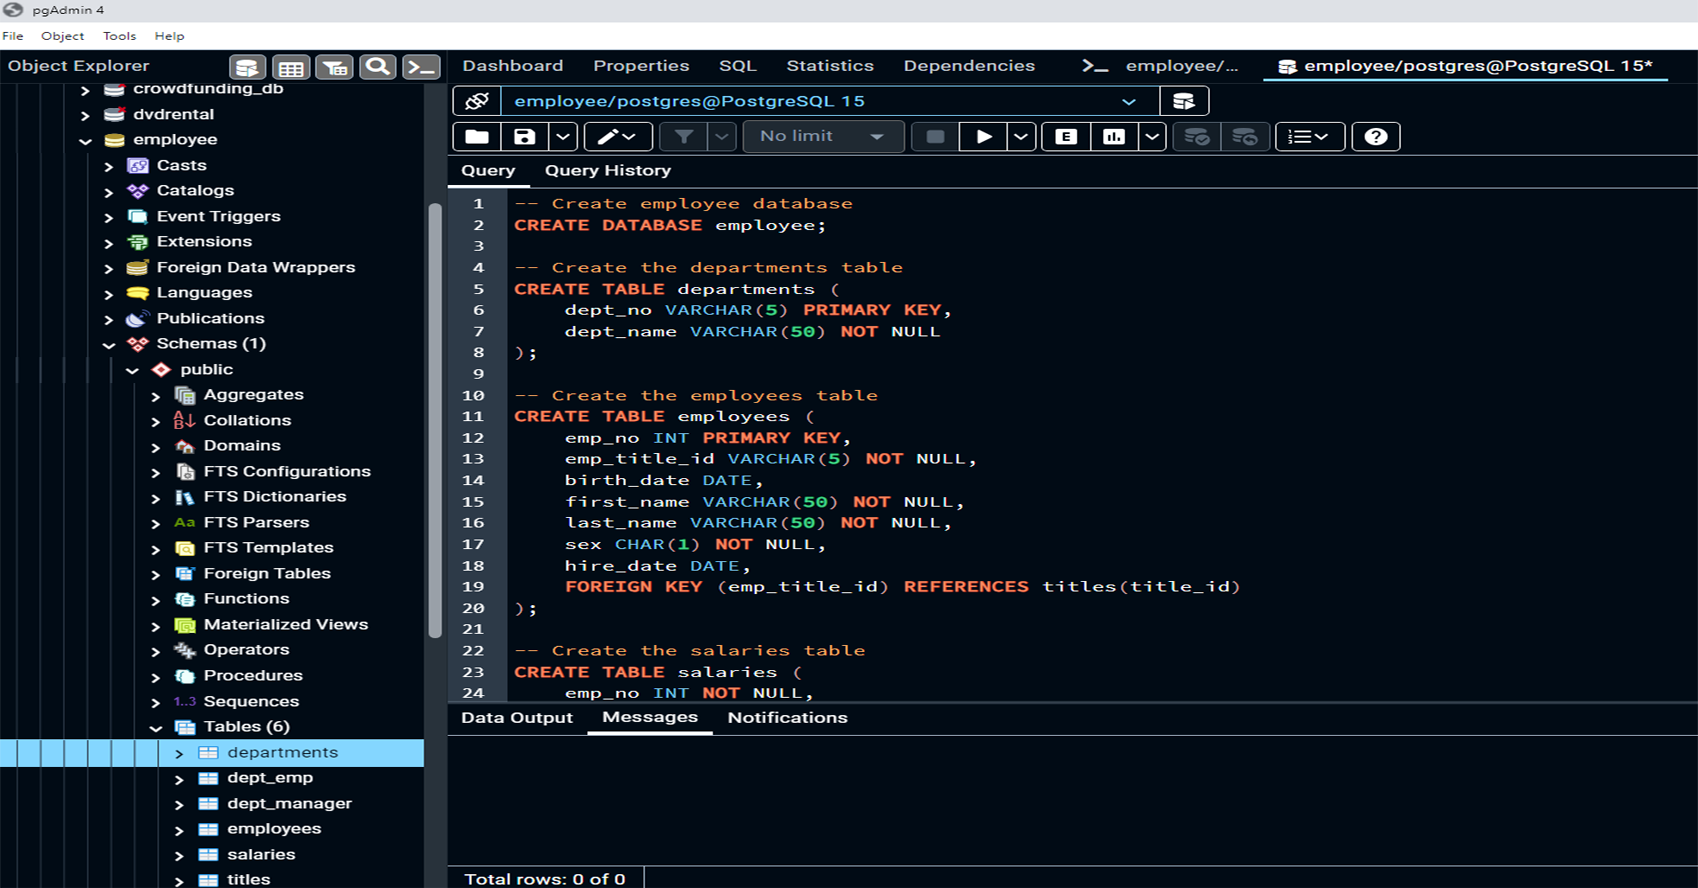
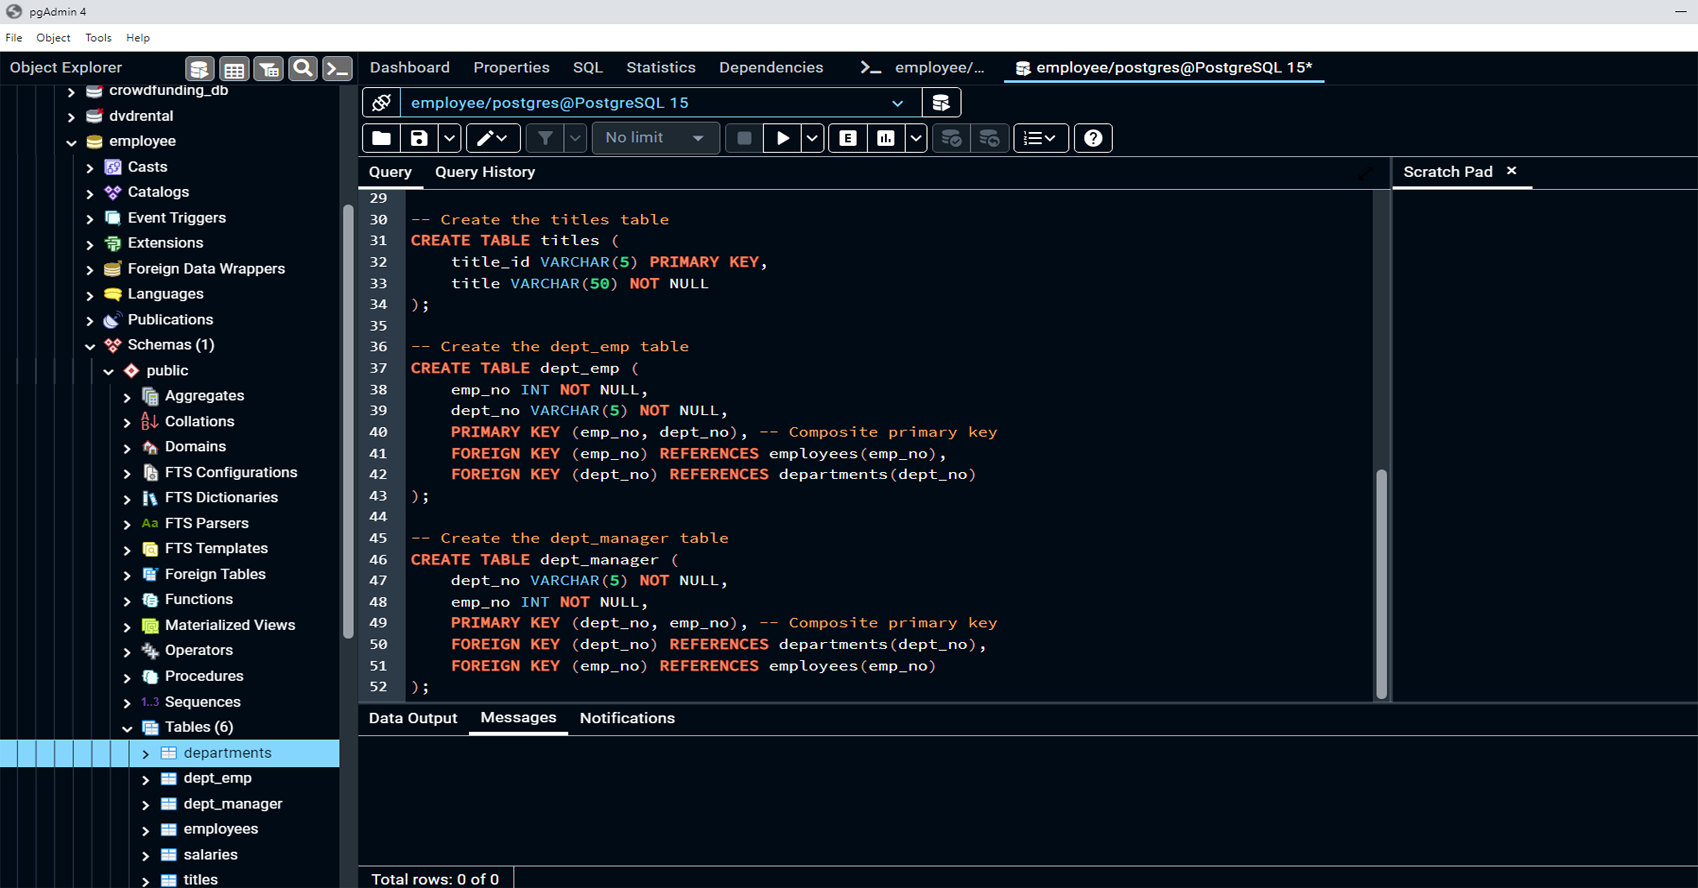
Created tables such as departments, employees, titles, salaries, dept_emp, and dept_manager in PostgreSQL, with well-defined columns and data types for each.
-
Established primary keys and foreign keys to enforce data integrity and maintain proper relationships between the tables.
-
Populating Tables:
-
Used INSERT statements to populate tables with data from the provided CSV files, ensuring all relationships and constraints are met during data insertion..
-
Data Analysis:
-
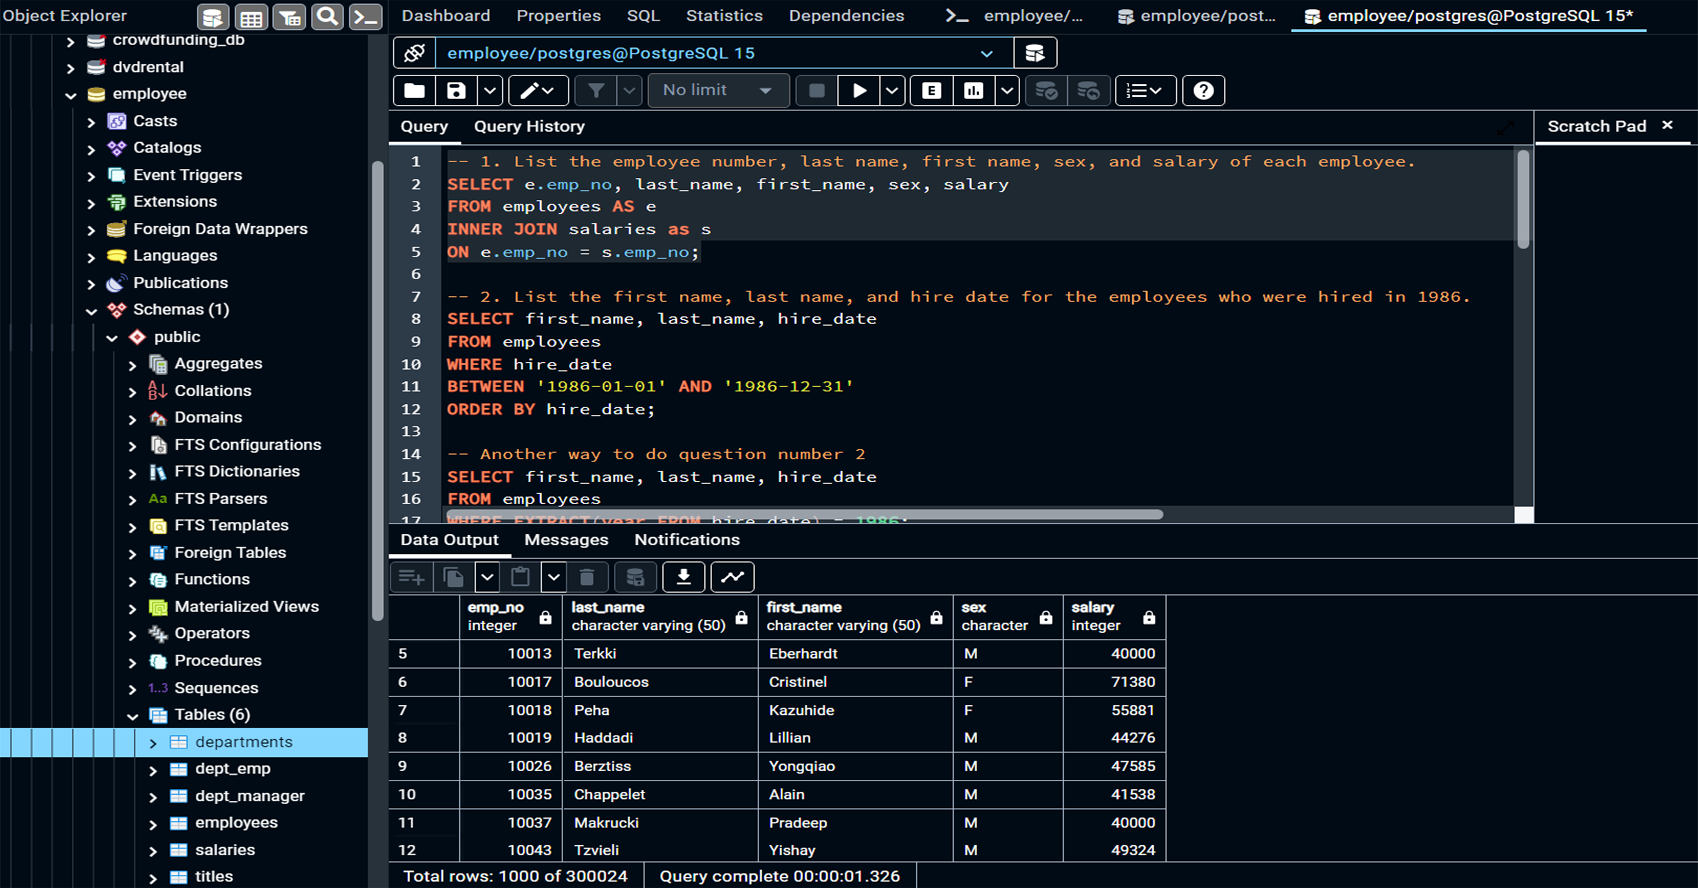
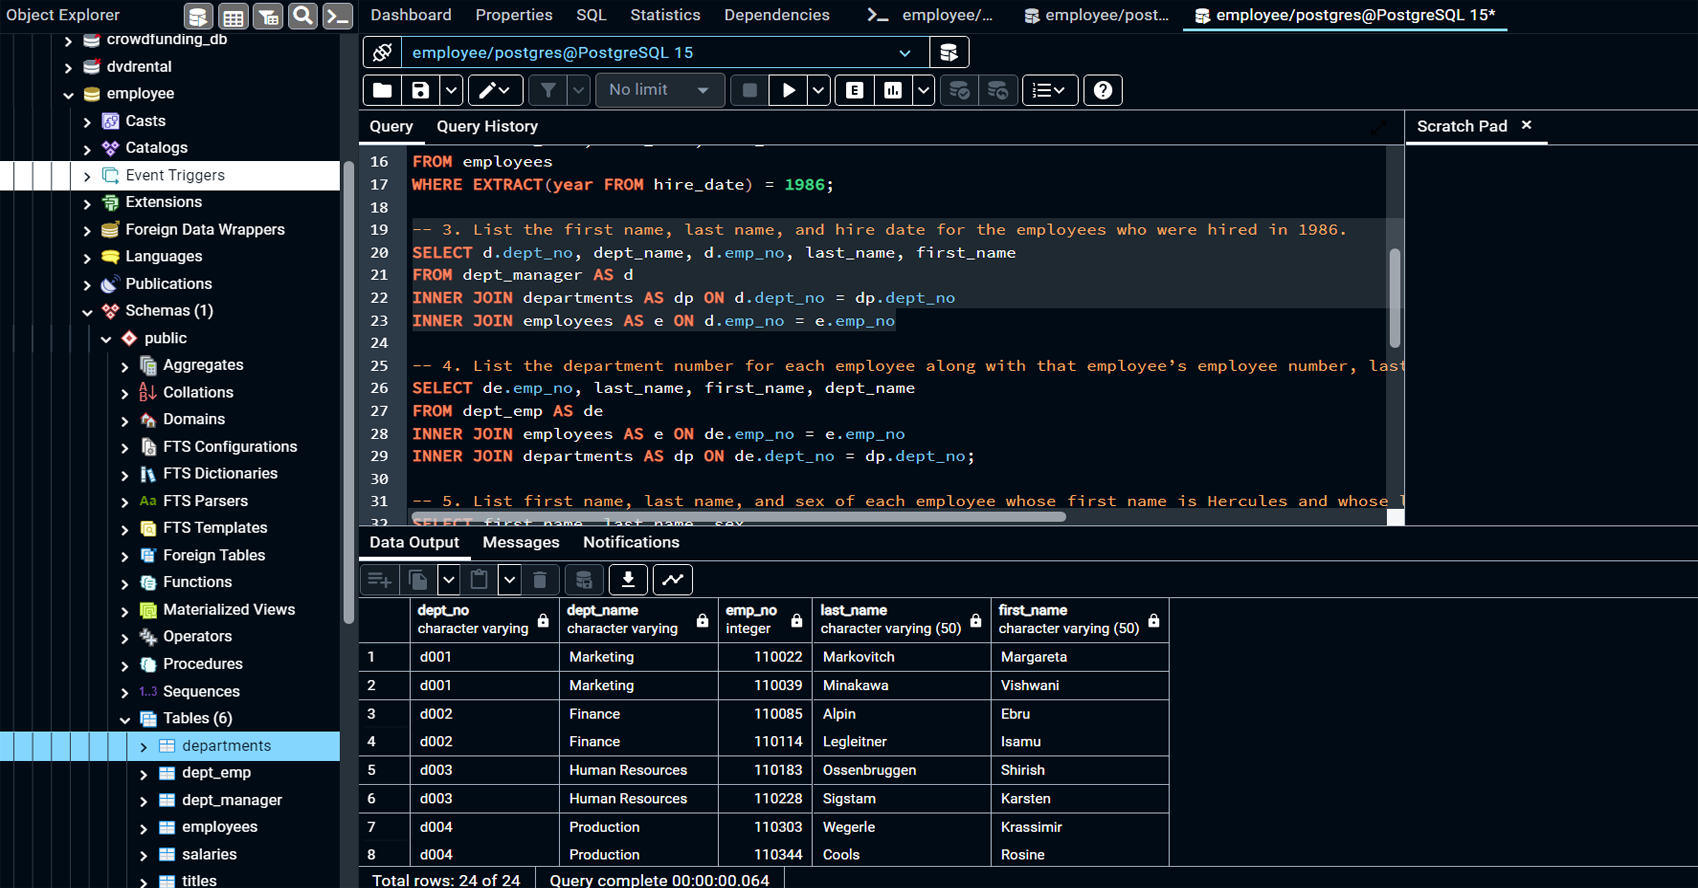
Wrote SQL queries to extract insights from the employee data, such as:
-
Retrieving employee demographic information (hire dates, departments, job titles).
-
Aggregating salary data to identify trends across departments and roles.
-
Filtering employees by hire year and identifying key patterns in employment
-
Conducted Exploratory Data Analysis (EDA) to explore questions such as:
-
Who are the managers of each department?
-
What are the most common last names among employees?
-
Which employees have the highest salaries and what are their job roles?
-
Documentation:
-
Thoroughly documented the process of creating tables, relationships, and executing queries within a Jupyter Notebook or equivalent file.
-
Provided explanations for each step of data modeling, engineering, and analysis to enhance readability and understanding for others.
GitHub Link: To see my project on GitHub
please click GitHub Repository button below
Project Summary:
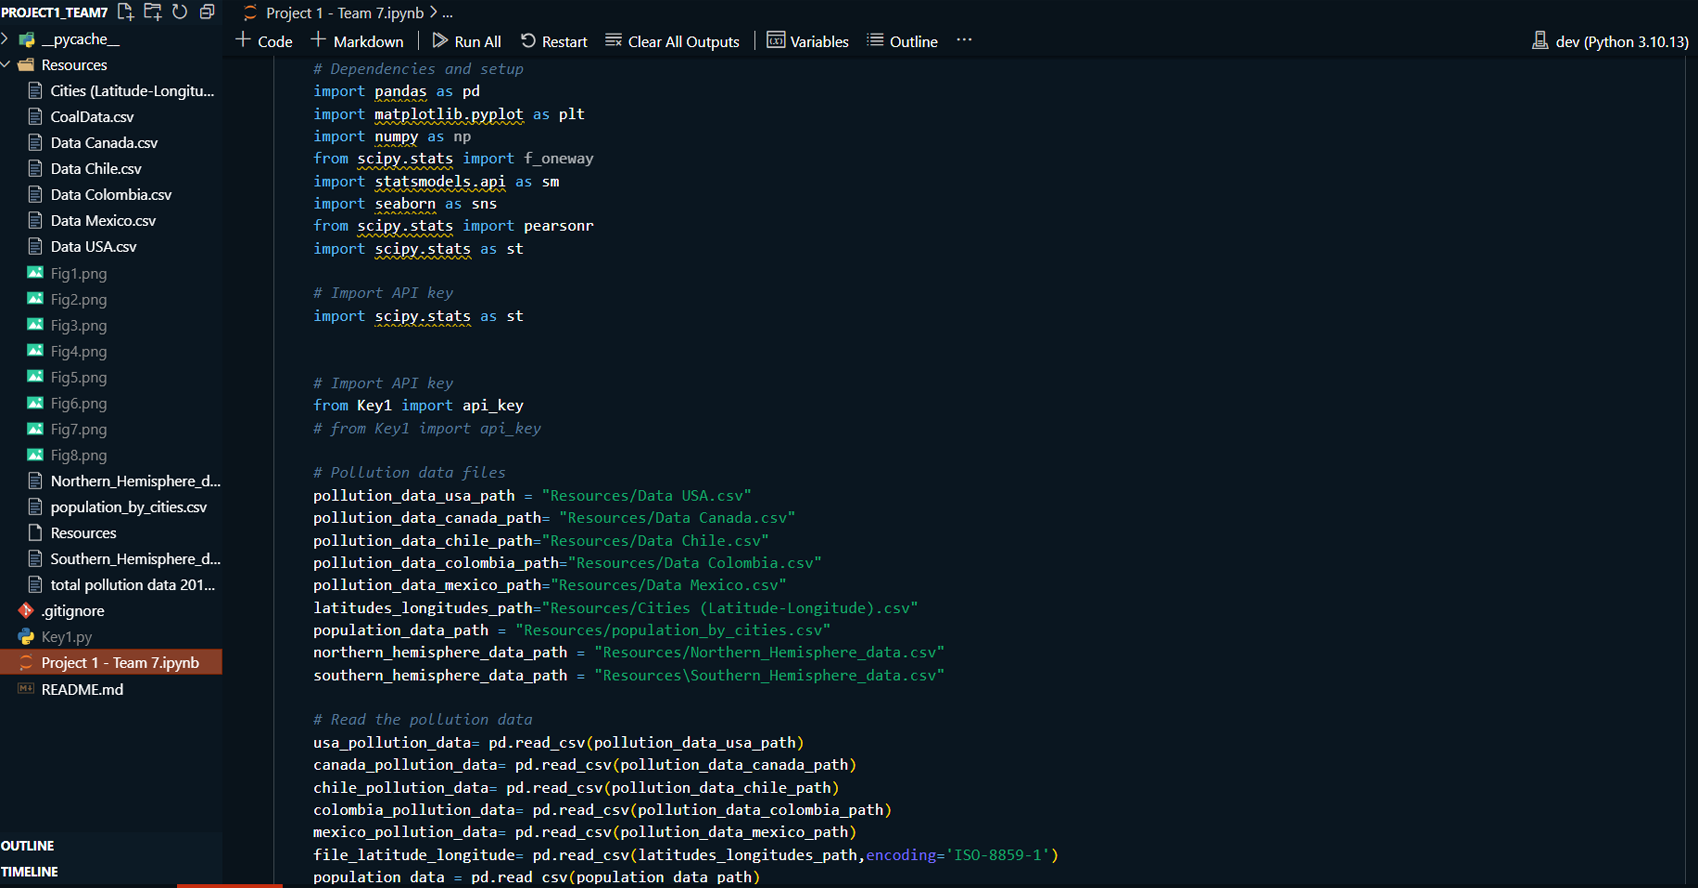
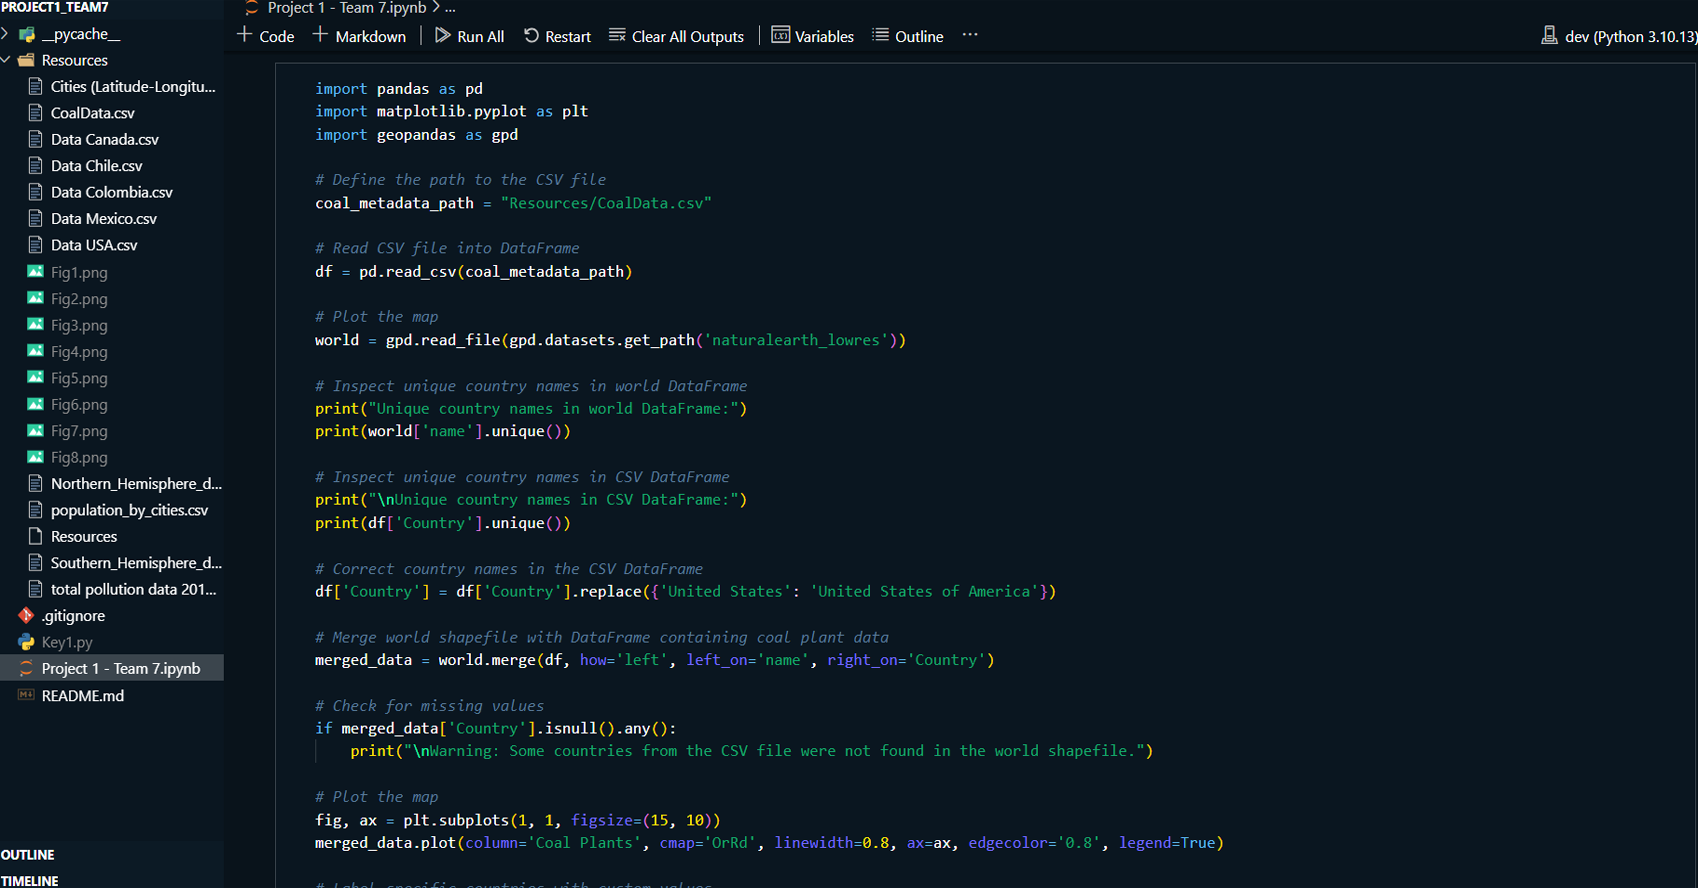
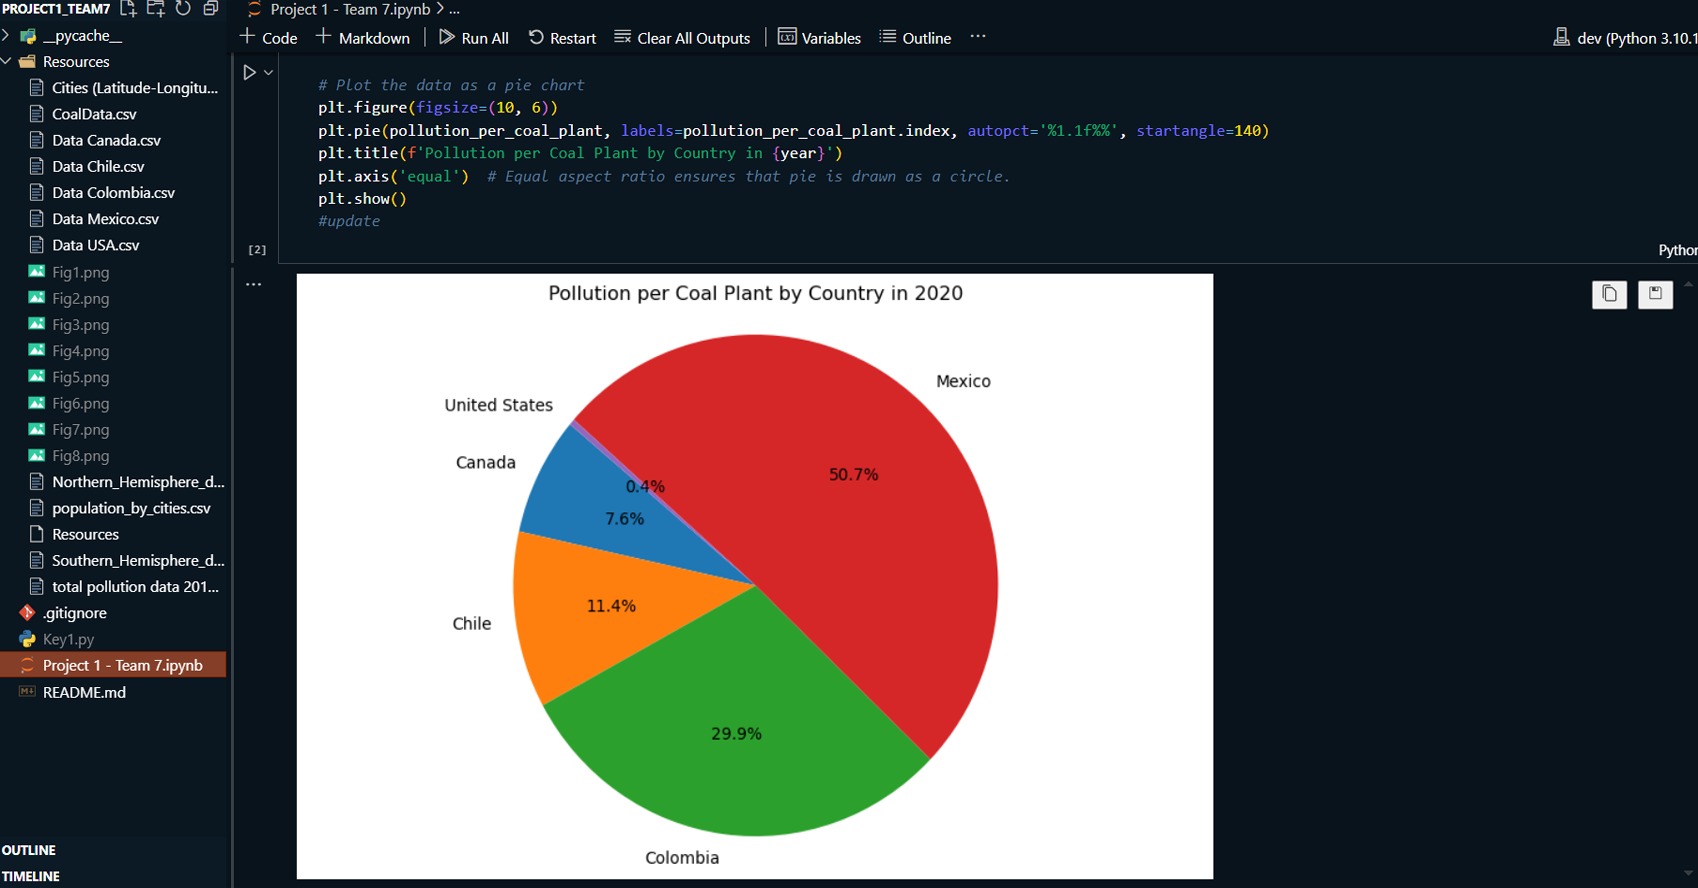
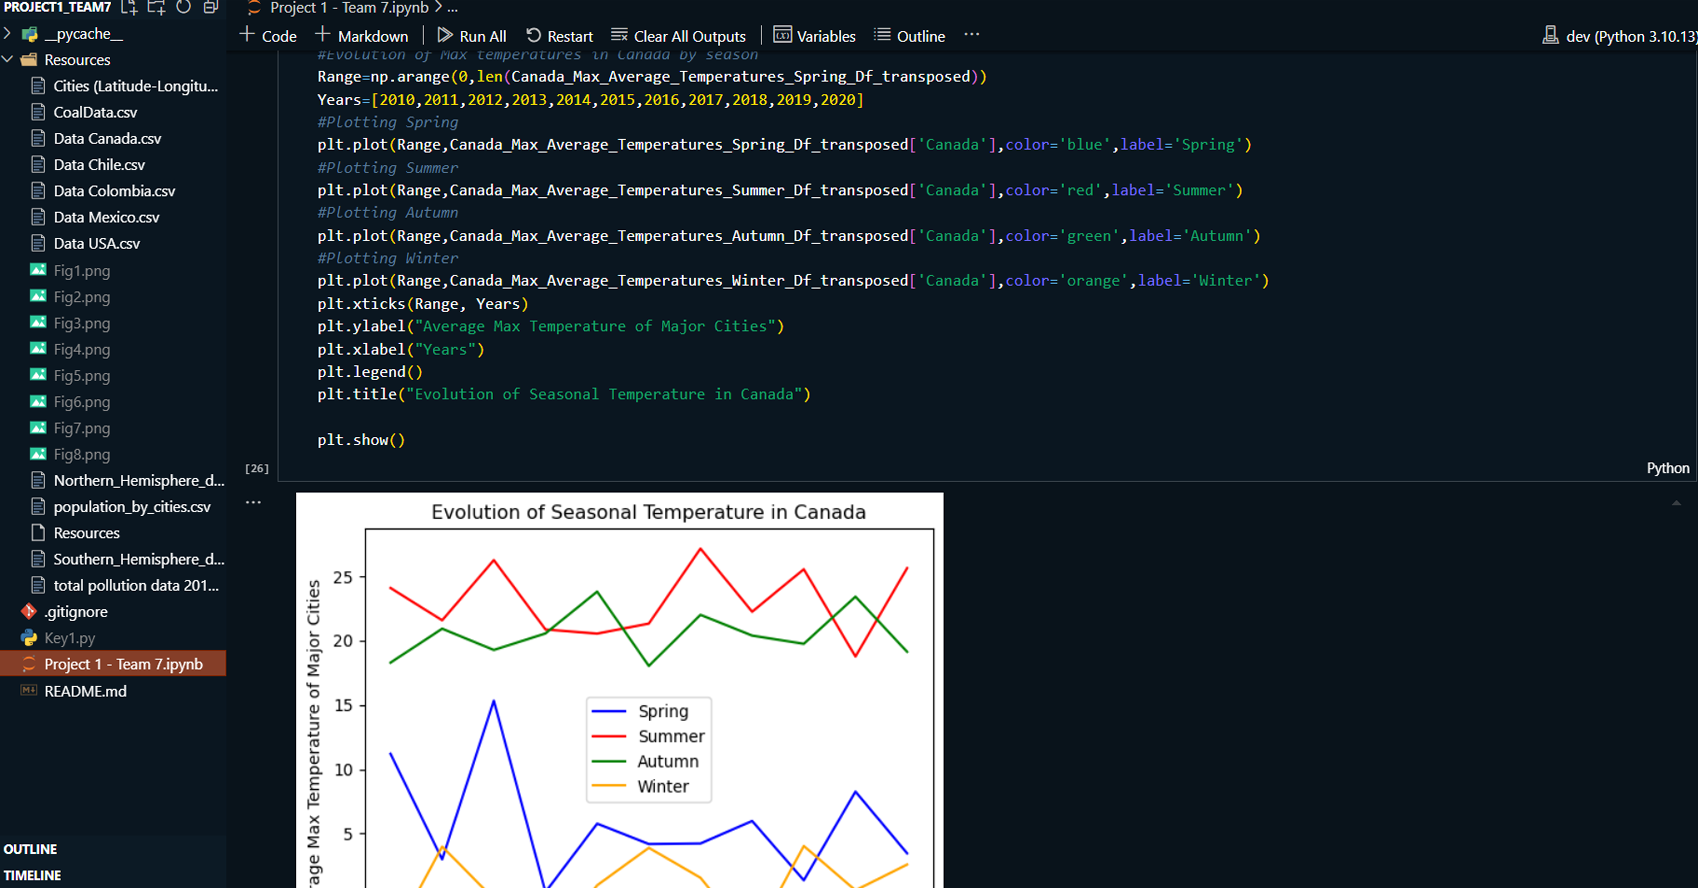
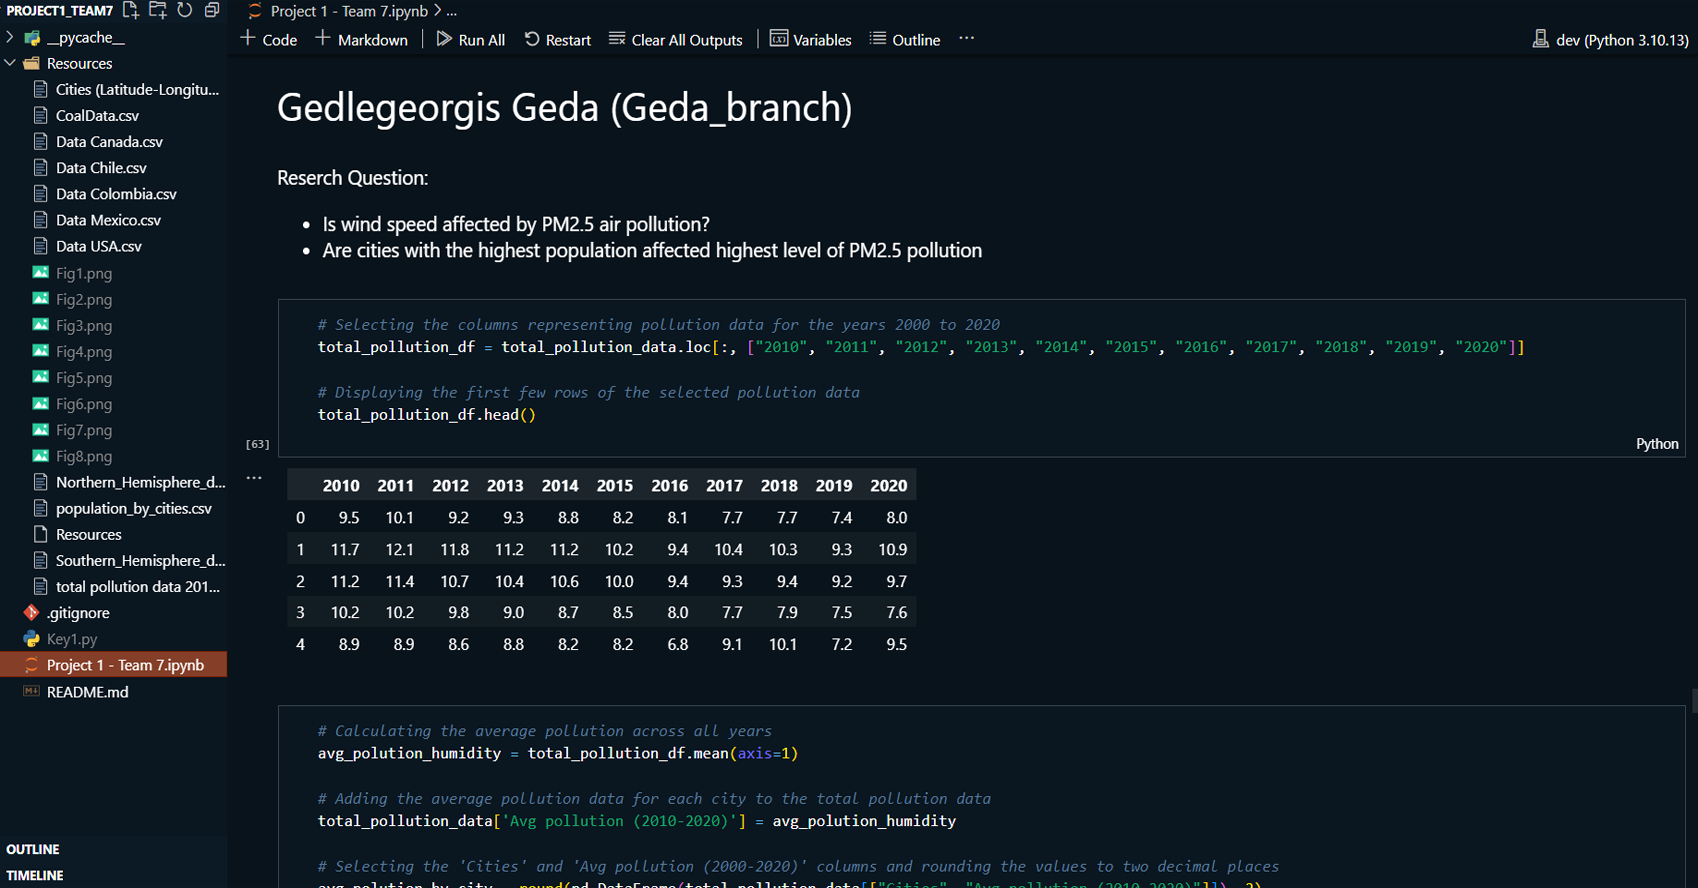
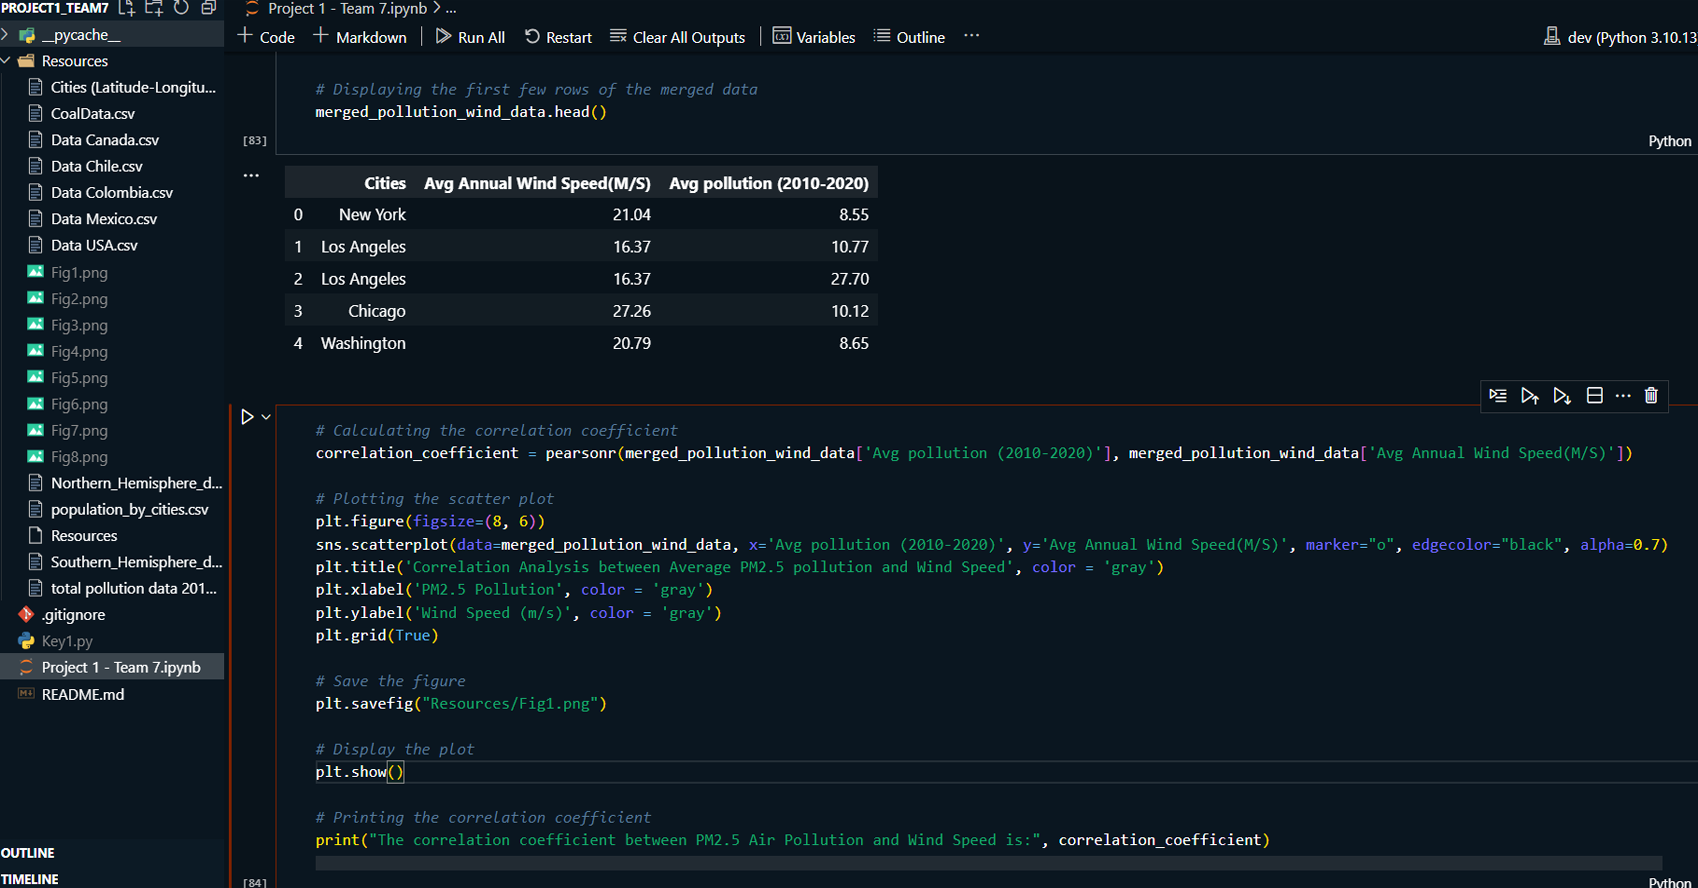
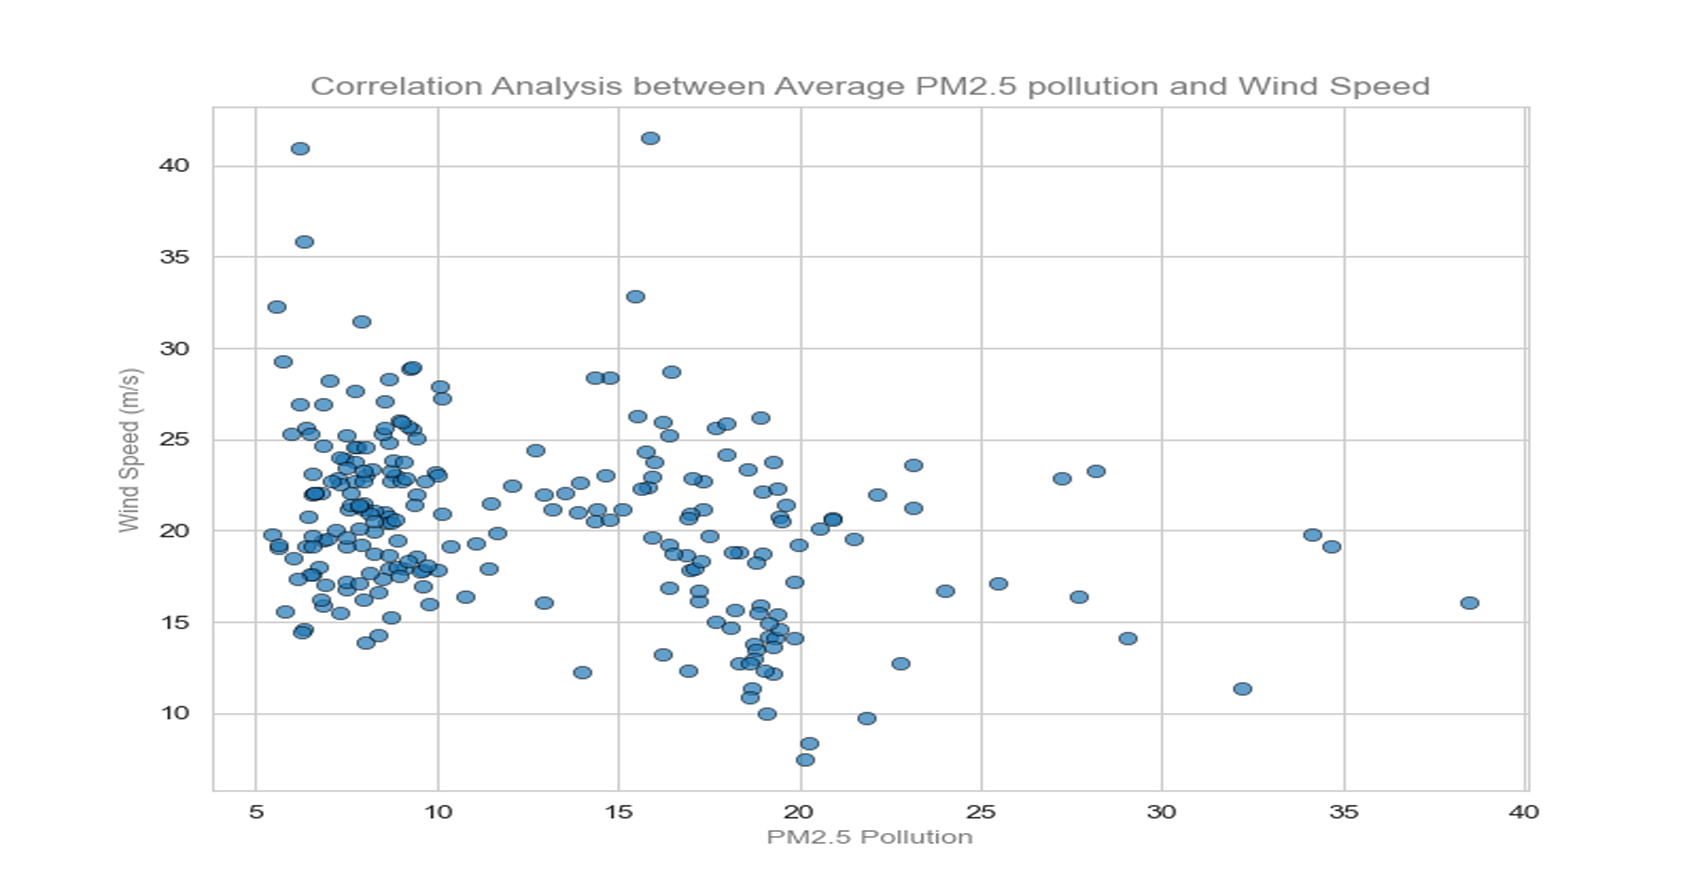
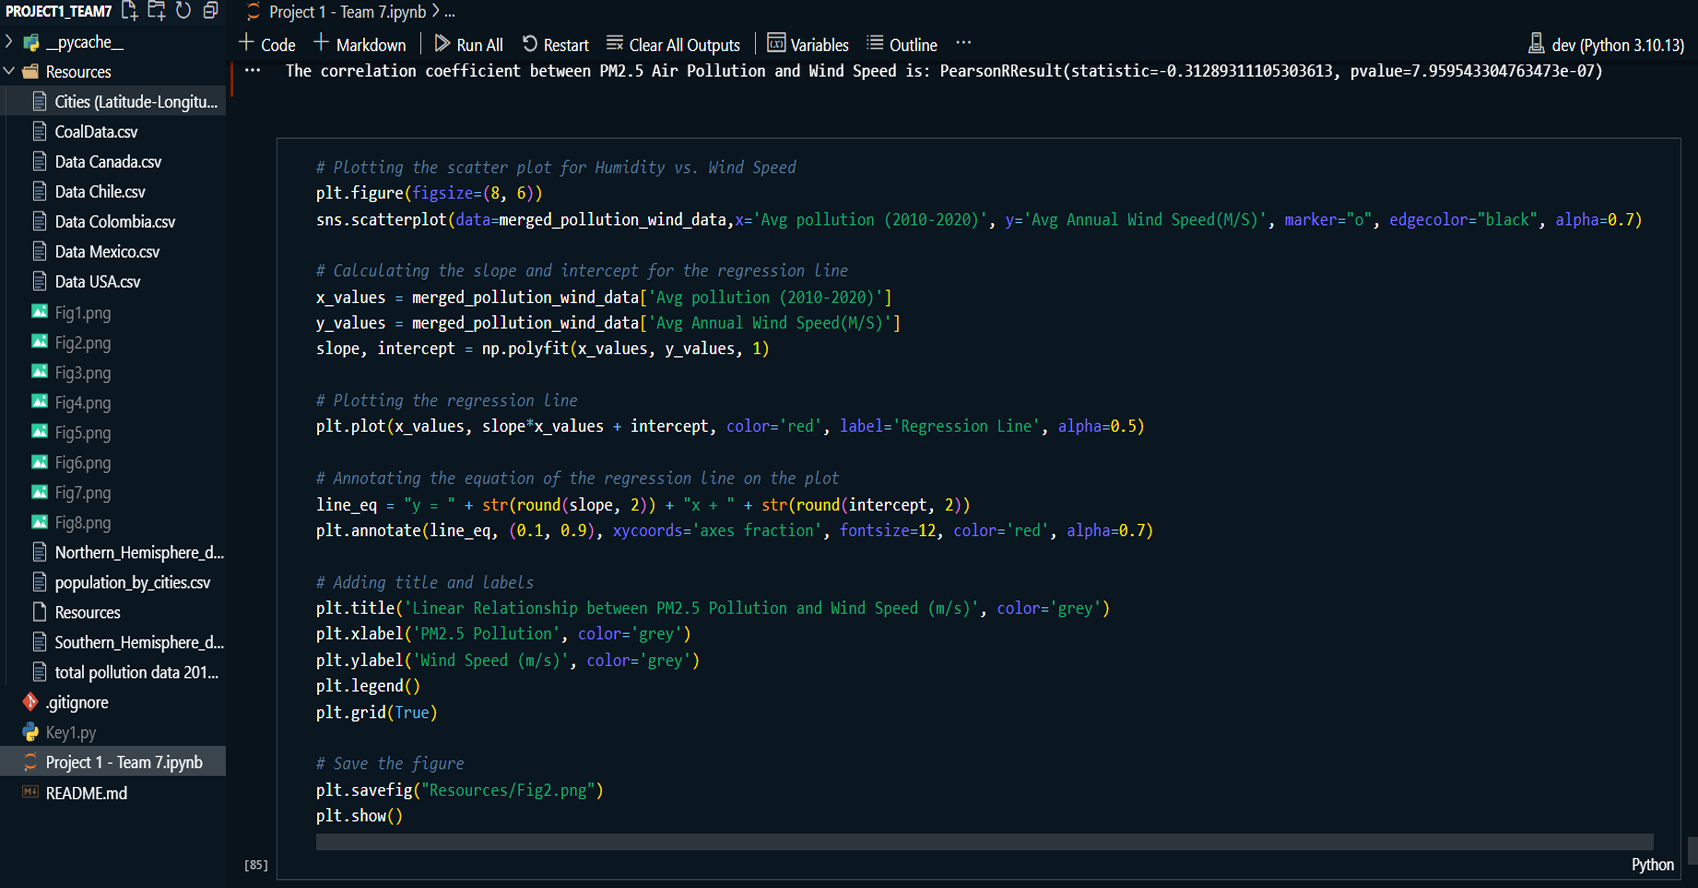
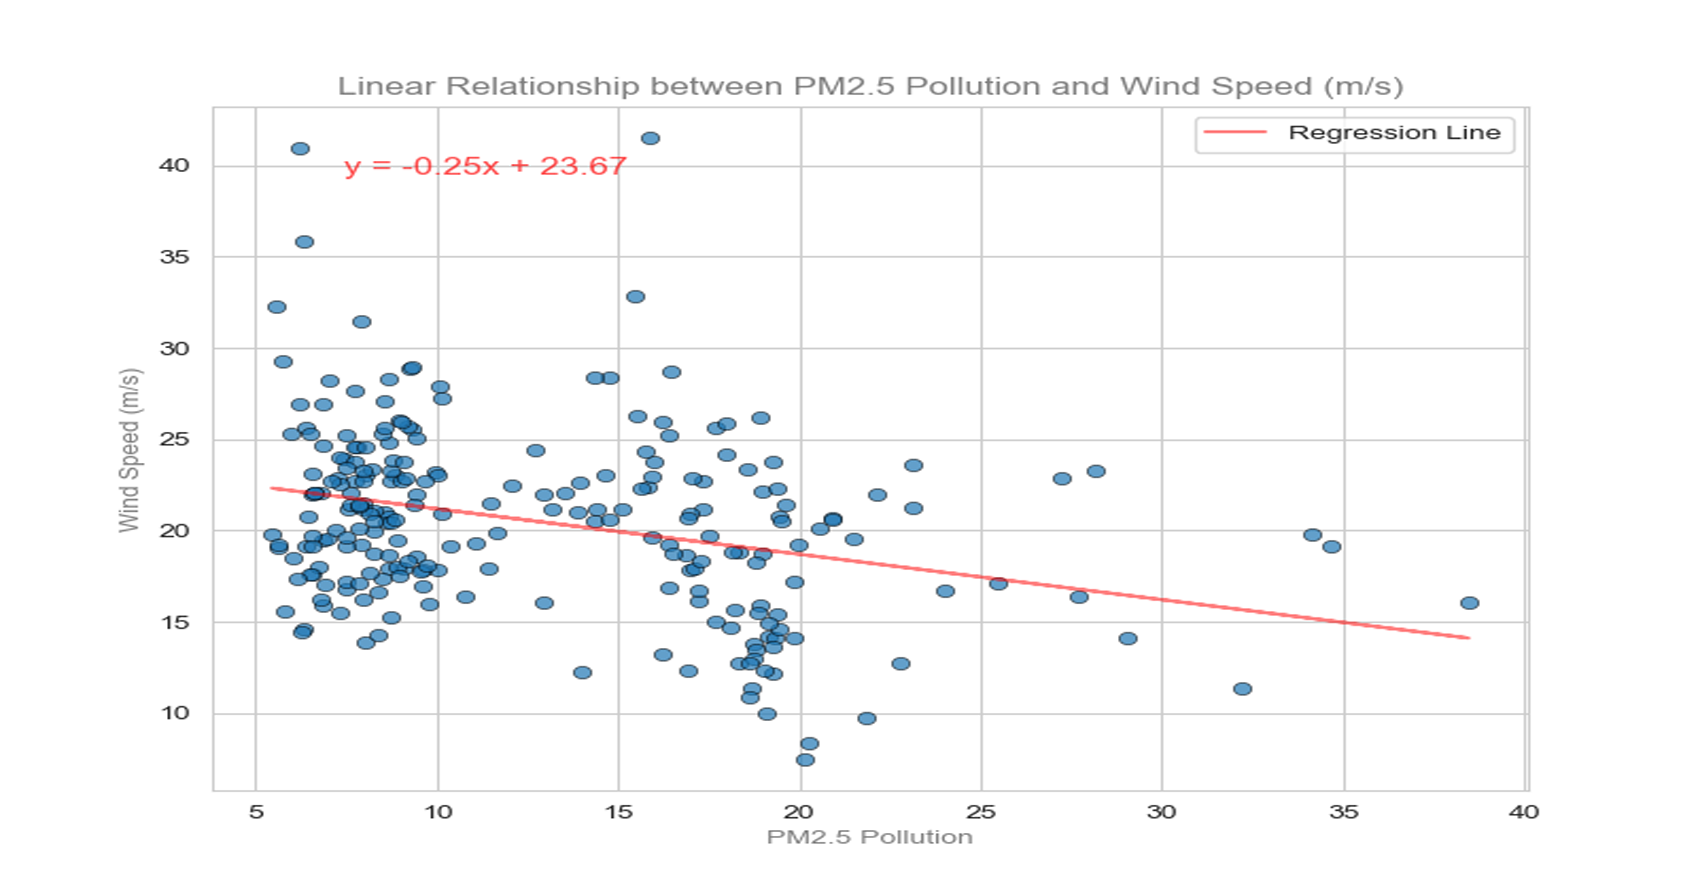
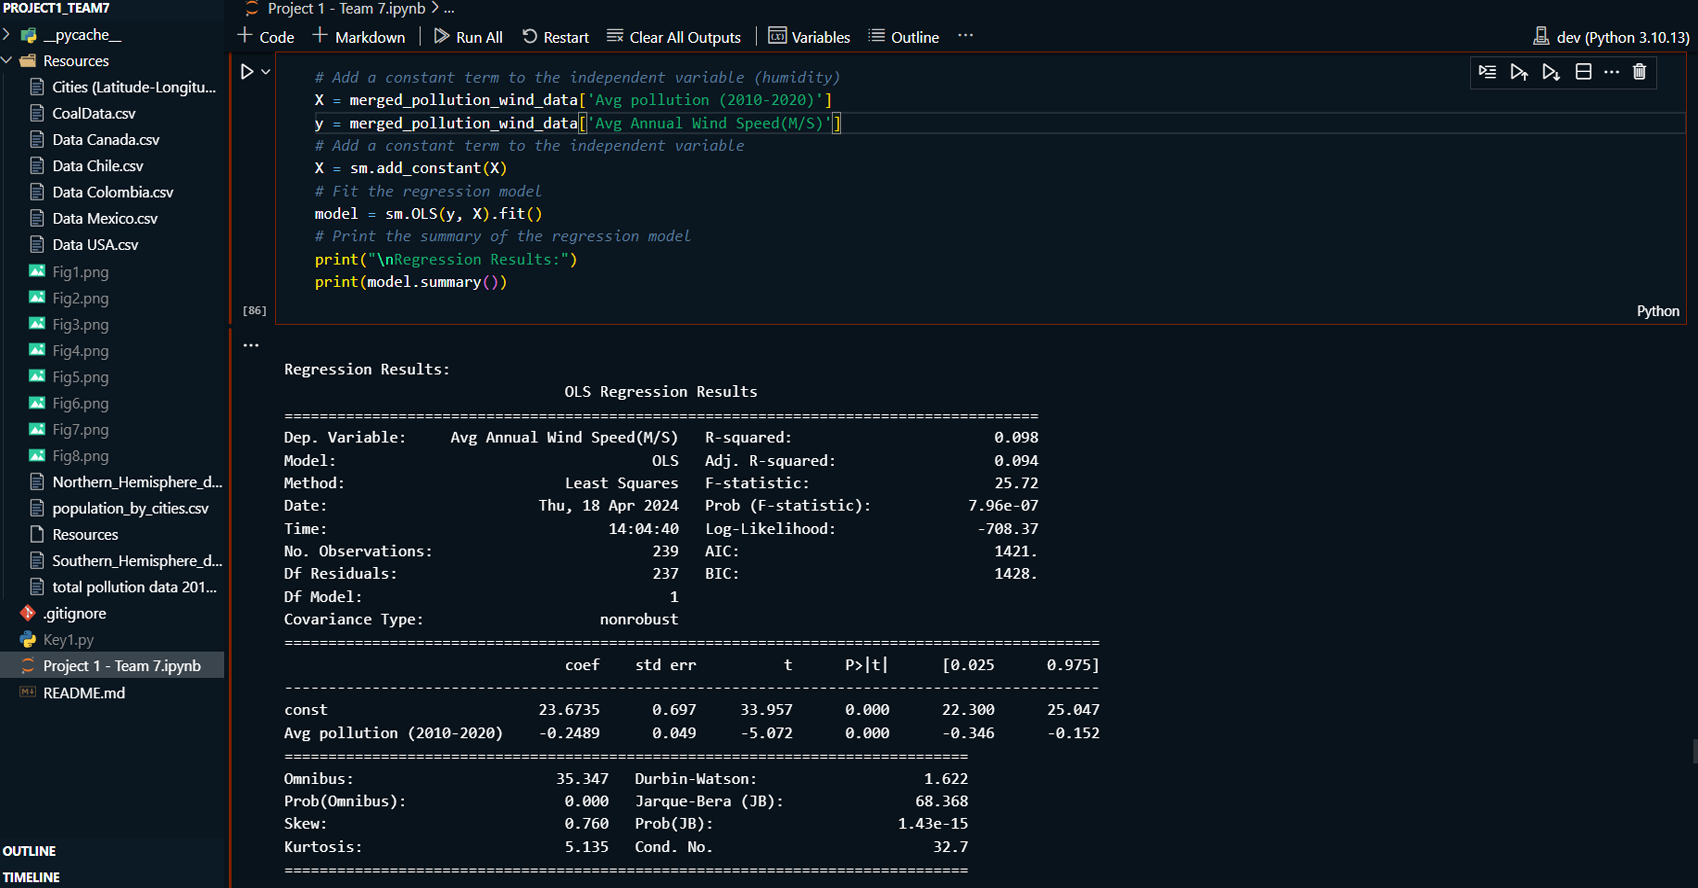
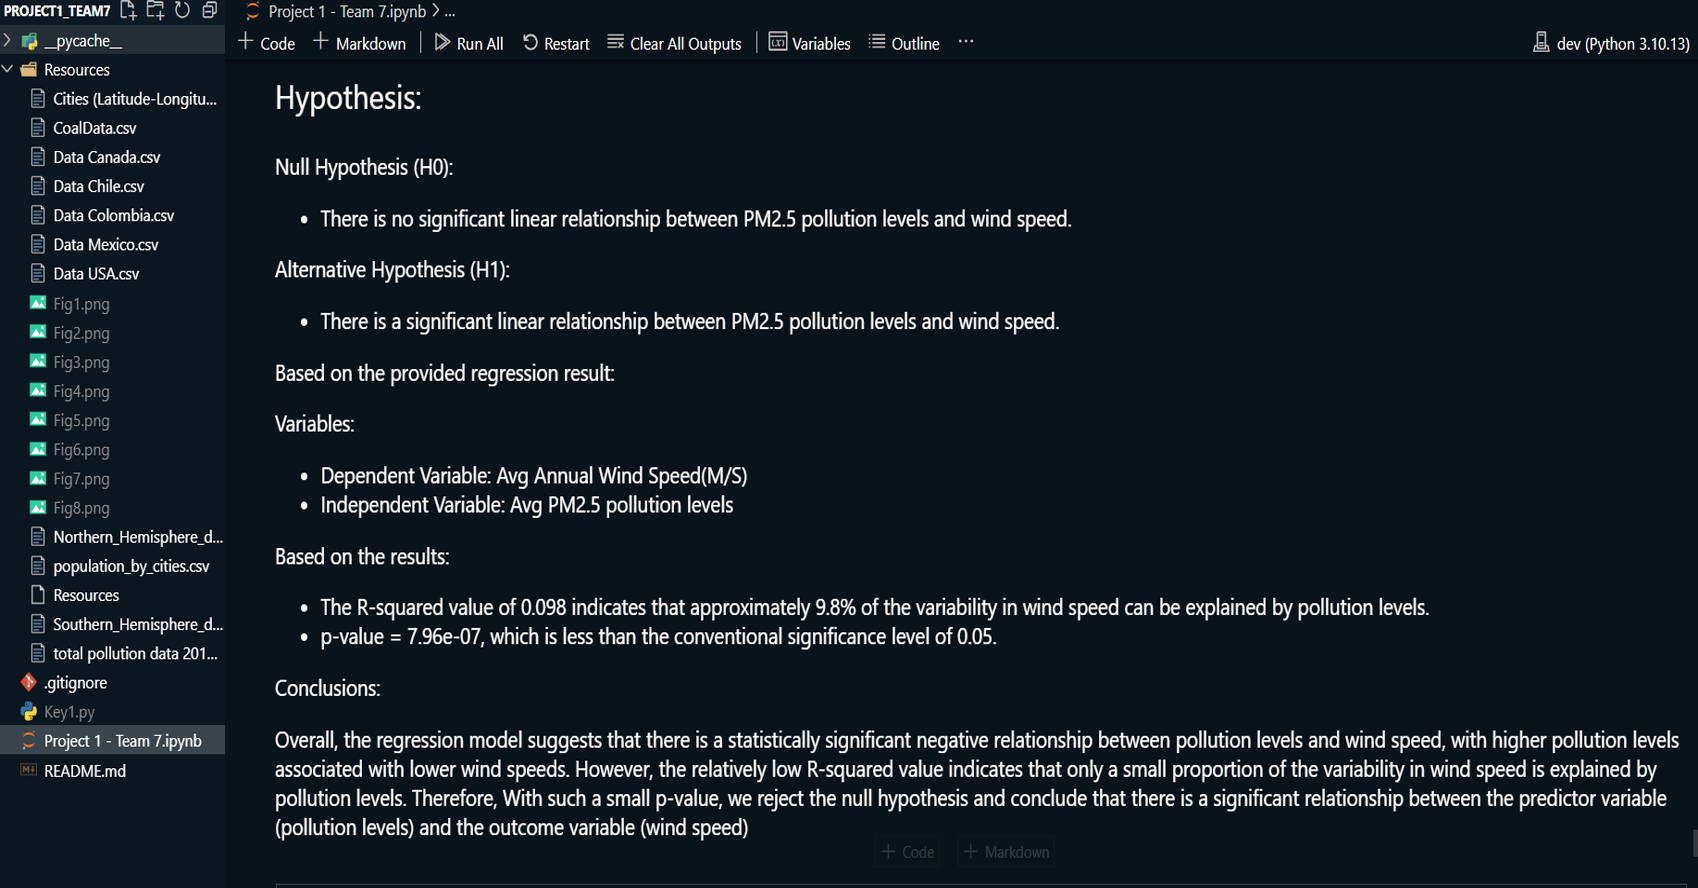
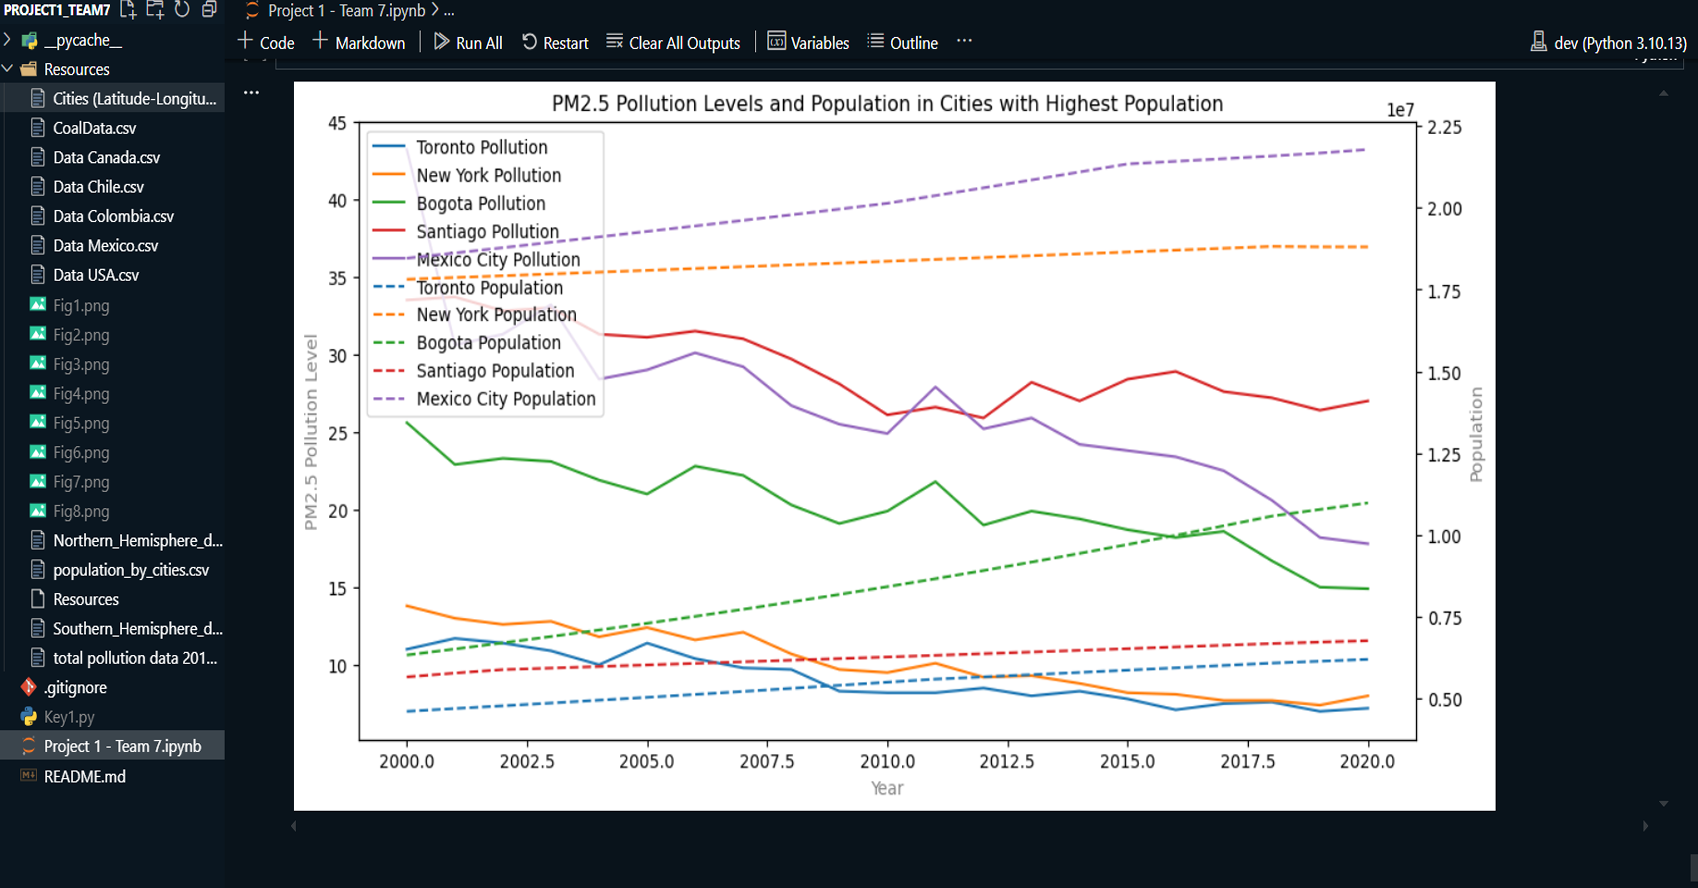
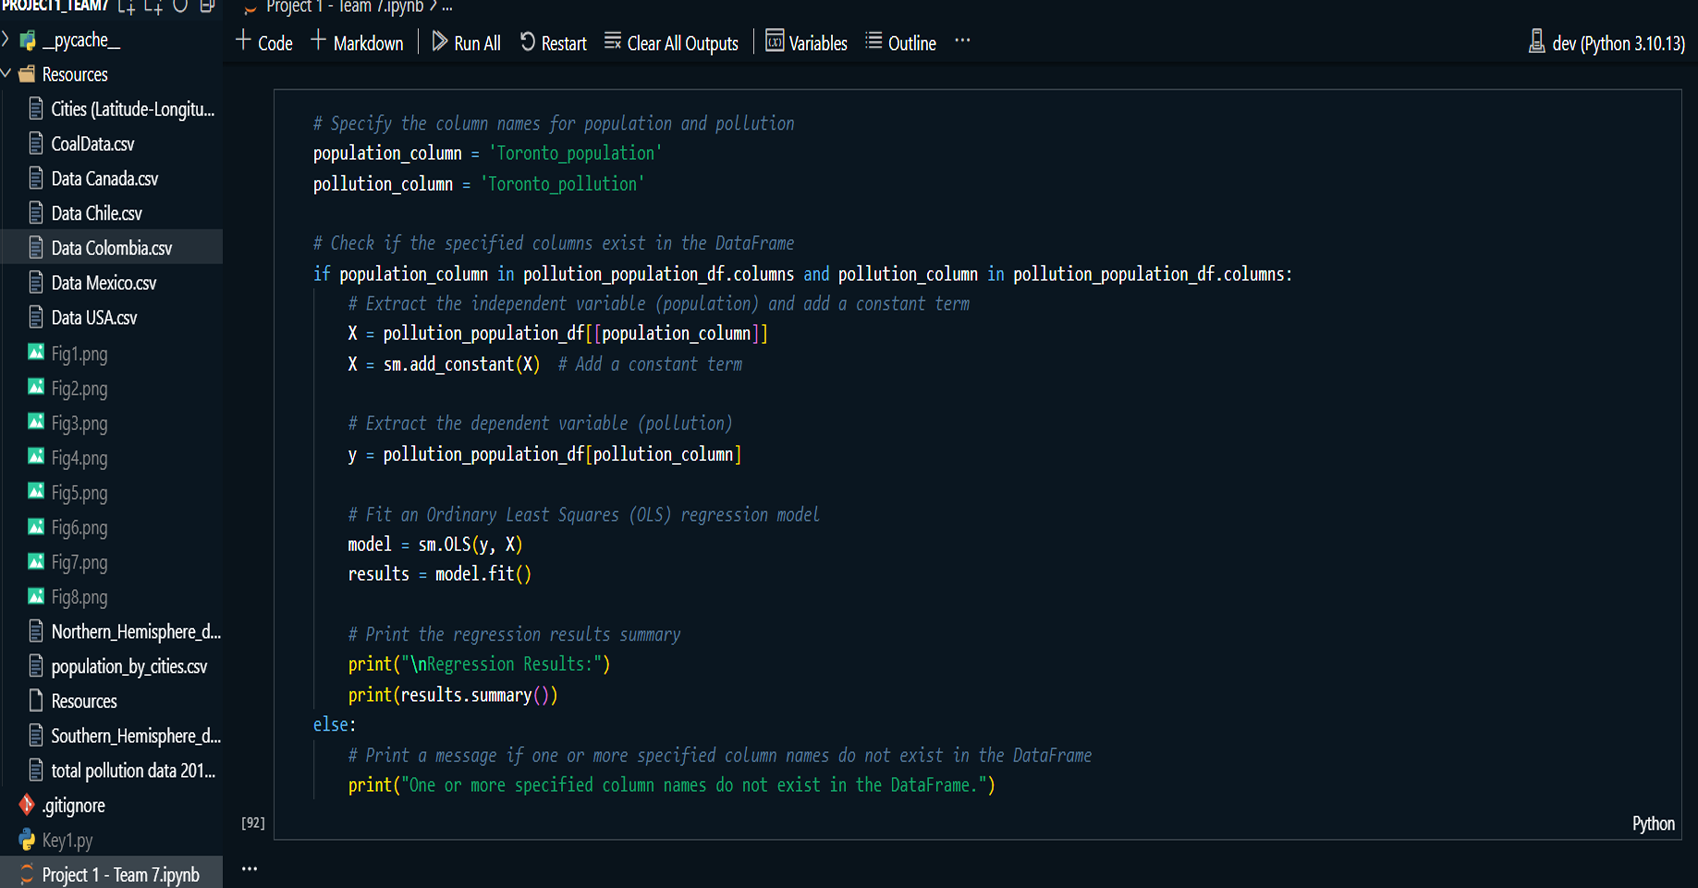
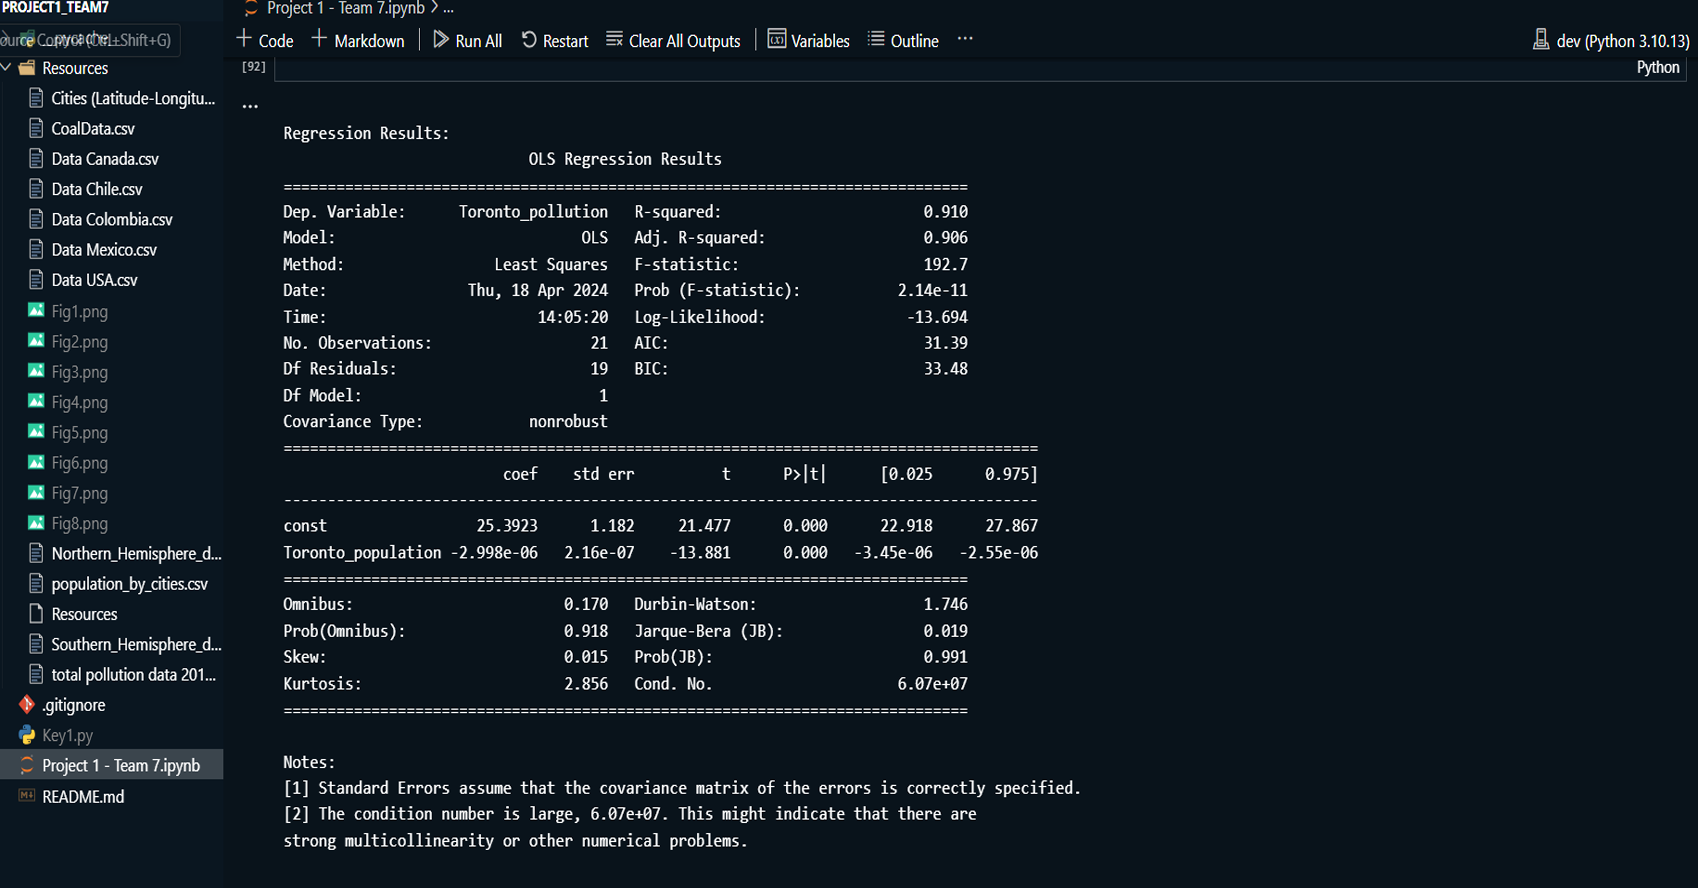
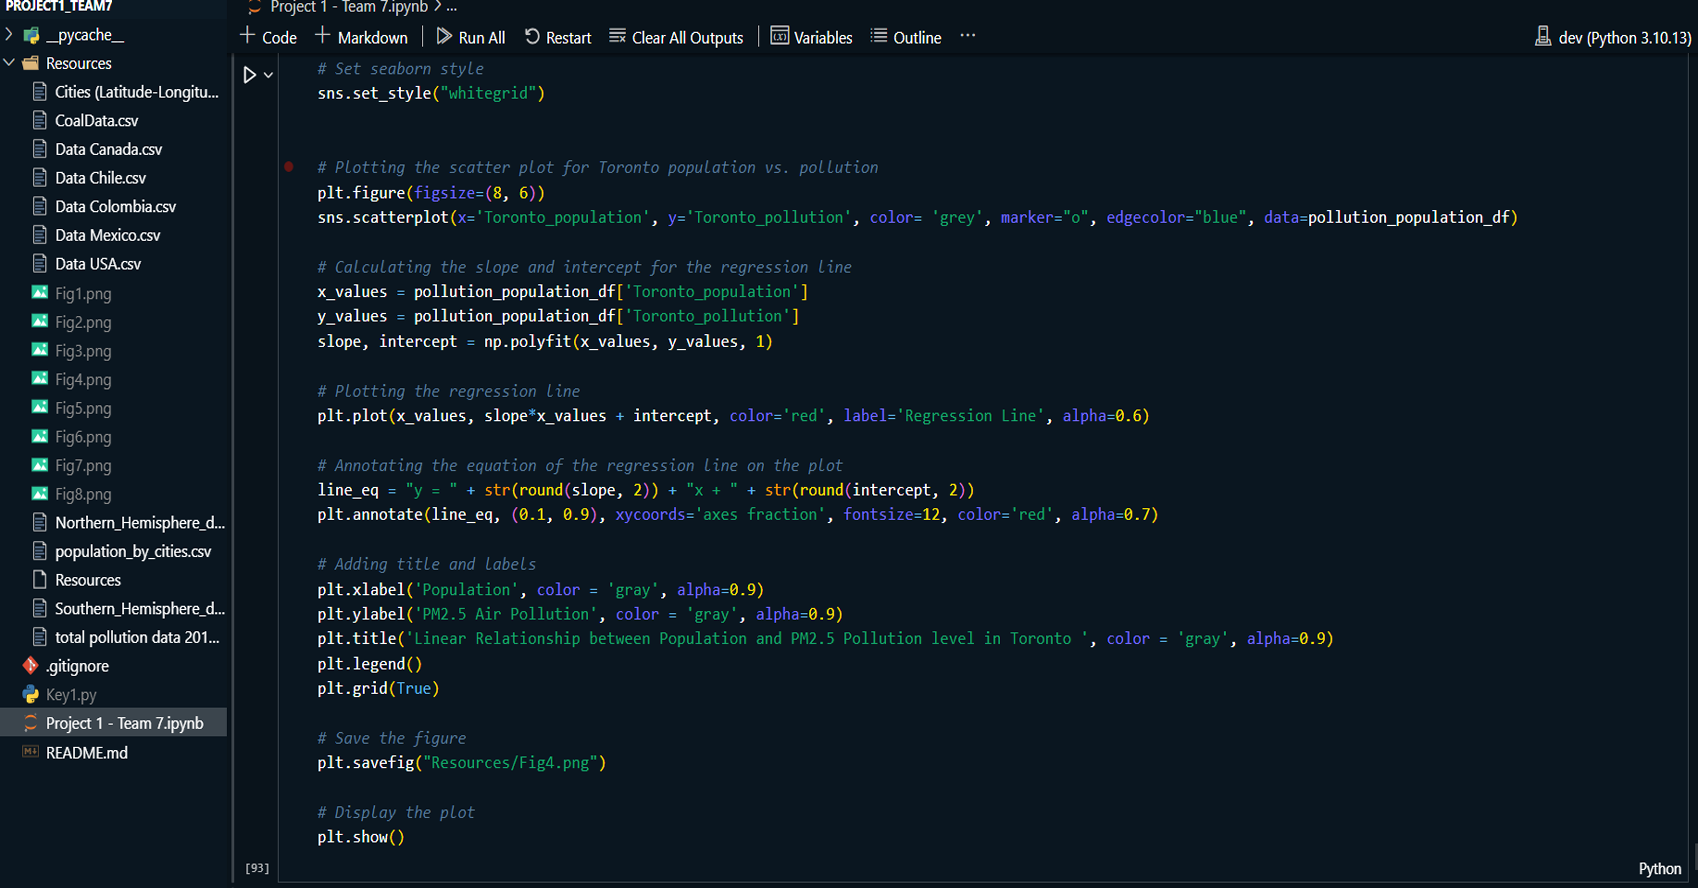
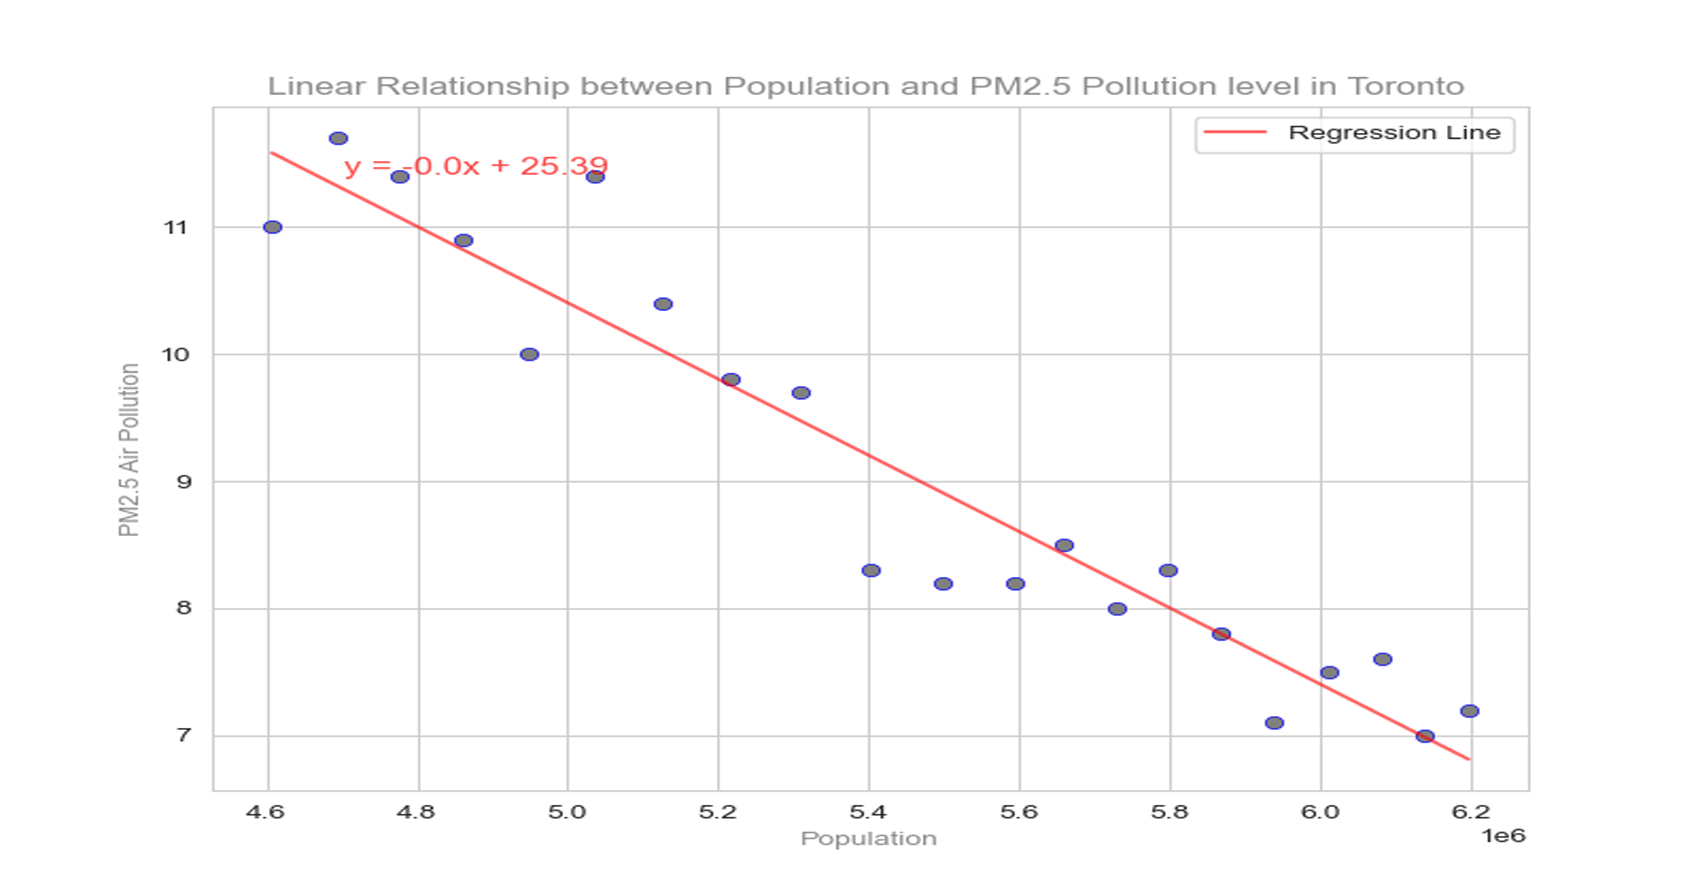
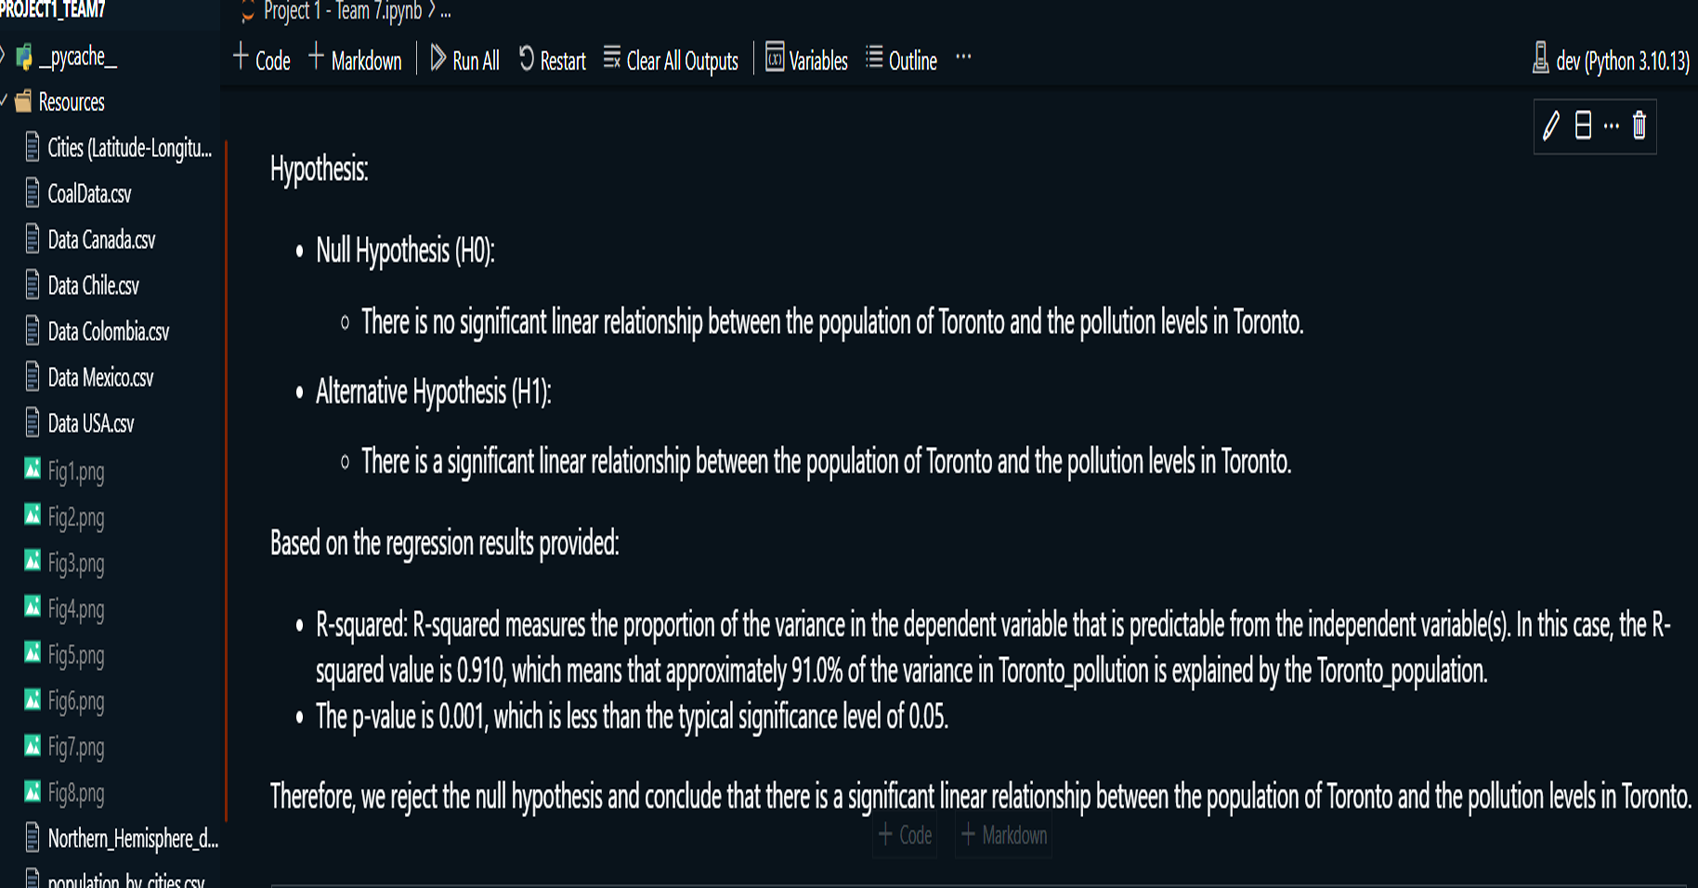
This project explores the correlation between rising global temperatures and increased levels of PM2.5 air pollution across selected countries: the USA, Canada, Mexico, Chile, and Colombia. The analysis includes historical temperature and pollution data, population metrics, and additional factors such as humidity and wind speed. The study employs various visualization techniques, including scatterplots, line charts, and regression plots, to assess relationships between temperature and air pollution trends. A geographical component is also introduced by mapping countries with coal plants to evaluate the impact of coal-based energy production on pollution density.
Read More
Technologies:
-
Python: FFor data analysis and visualization.
-
Pandas: For data manipulation and analysis.
-
Matplotlib & Seaborn: For mapping coal plants and visualizing geographical relationships.
-
GeoPandas: For the source data files.
-
Jupyter Notebook: For interactive code execution and visualizations.
-
VSCode: : Alternative IDE for running the project.
-
Git: For version control and repository management.
-
Anaconda: For managing Python environment and dependencies.
Contributions:
-
Data Collection & Preparation:
-
Collected and organized historical data on global temperature and PM2.5 air pollution for the USA, Canada, Mexico, Chile, and Colombia.
-
Integrated population data and geographical information on coal plants for a more comprehensive analysis.
-
Cleaned and formatted data using Pandas to prepare for analysis and visualization.
-
Data Analysis & Visualization:
-
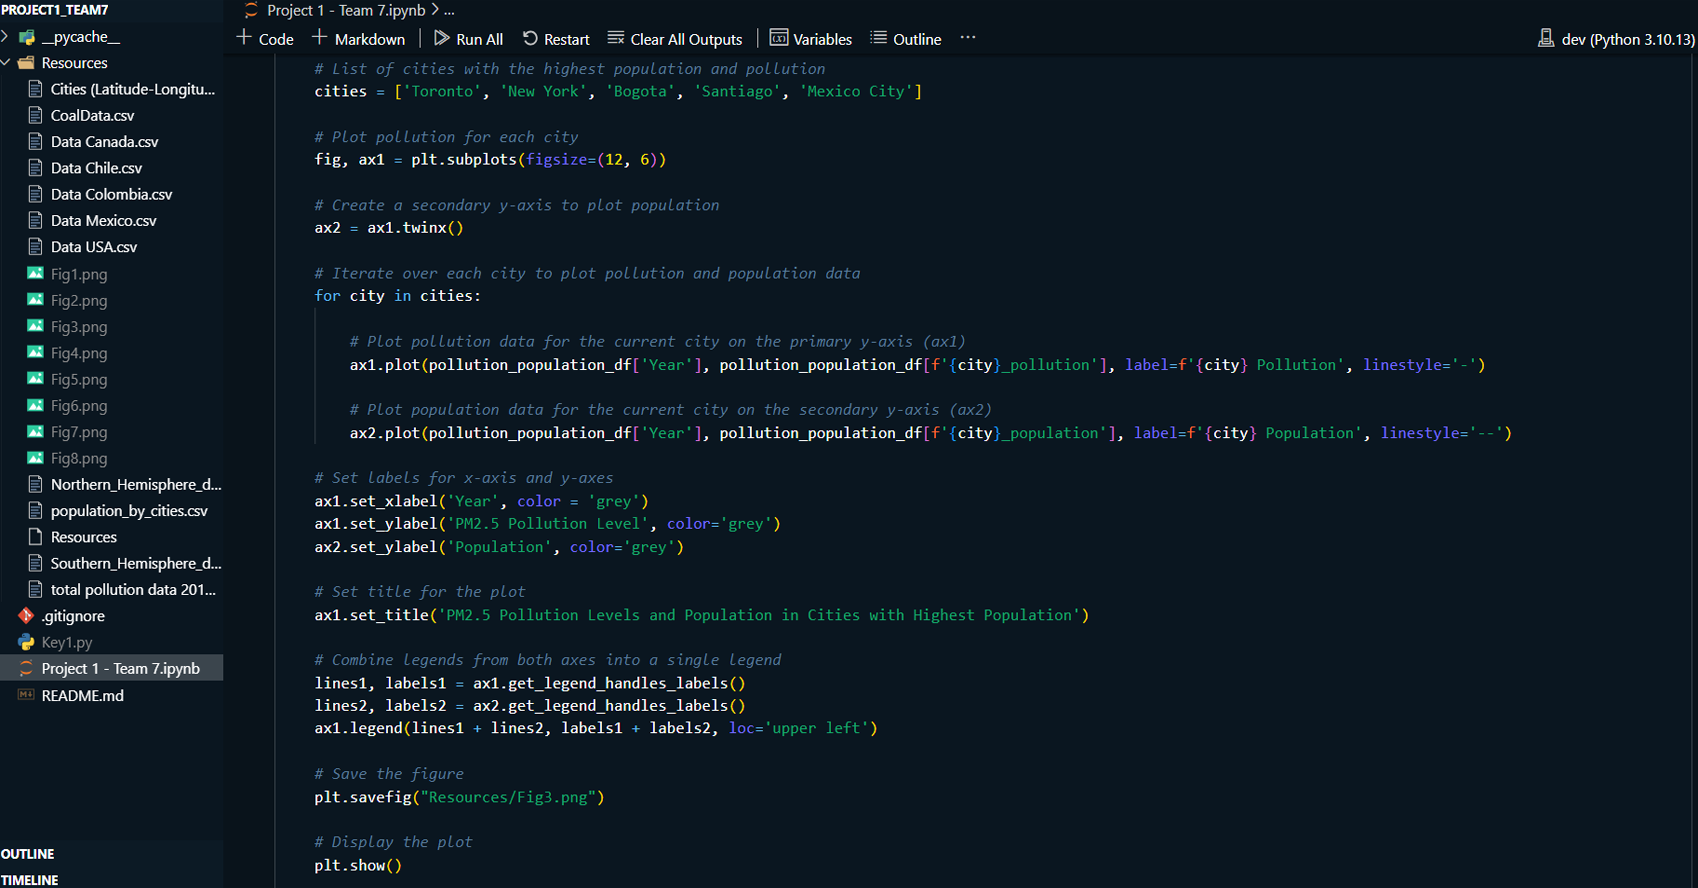
Created line charts and regression plots to visualize the relationship between temperature and pollution over time.
-
Used scatterplots to explore trends in air pollution across North and South America, analyzing how temperature, humidity, wind speed, and other factors correlate with pollution levels.
-
Mapped coal plant locations using GeoPandas, comparing pollution levels in regions with different coal plant densities.
-
Geo-visualization:
-
Implemented geographical analysis to examine the distribution of coal plants and their potential impact on air pollution.
-
Developed GeoPandas maps to show pollution hotspots and areas of high coal plant concentration in the selected countries.
-
Technical Setup & Execution:
-
Set up the project environment using Anaconda, ensuring all dependencies were correctly installed for GeoPandas and visualization libraries.
-
Documented step-by-step instructions for executing the program, including installation of required software, cloning the repository, and running the Jupyter Notebook.
-
Contributed to troubleshooting and ensuring the code runs efficiently in both VSCode and Jupyter Notebook environments.
-
Documentation:
-
Authored detailed instructions for running the analysis in the project README, including environment setup, installation steps, and code execution.
-
Provided comprehensive explanations of the analysis methods and visualizations to guide users through the process of interpreting the results.
-
Collaboration:
-
Collaborated with other team member to ensure data
integration.
GitHub Link: To see my project on GitHub
please click GitHub Repository button below
Project Summary:
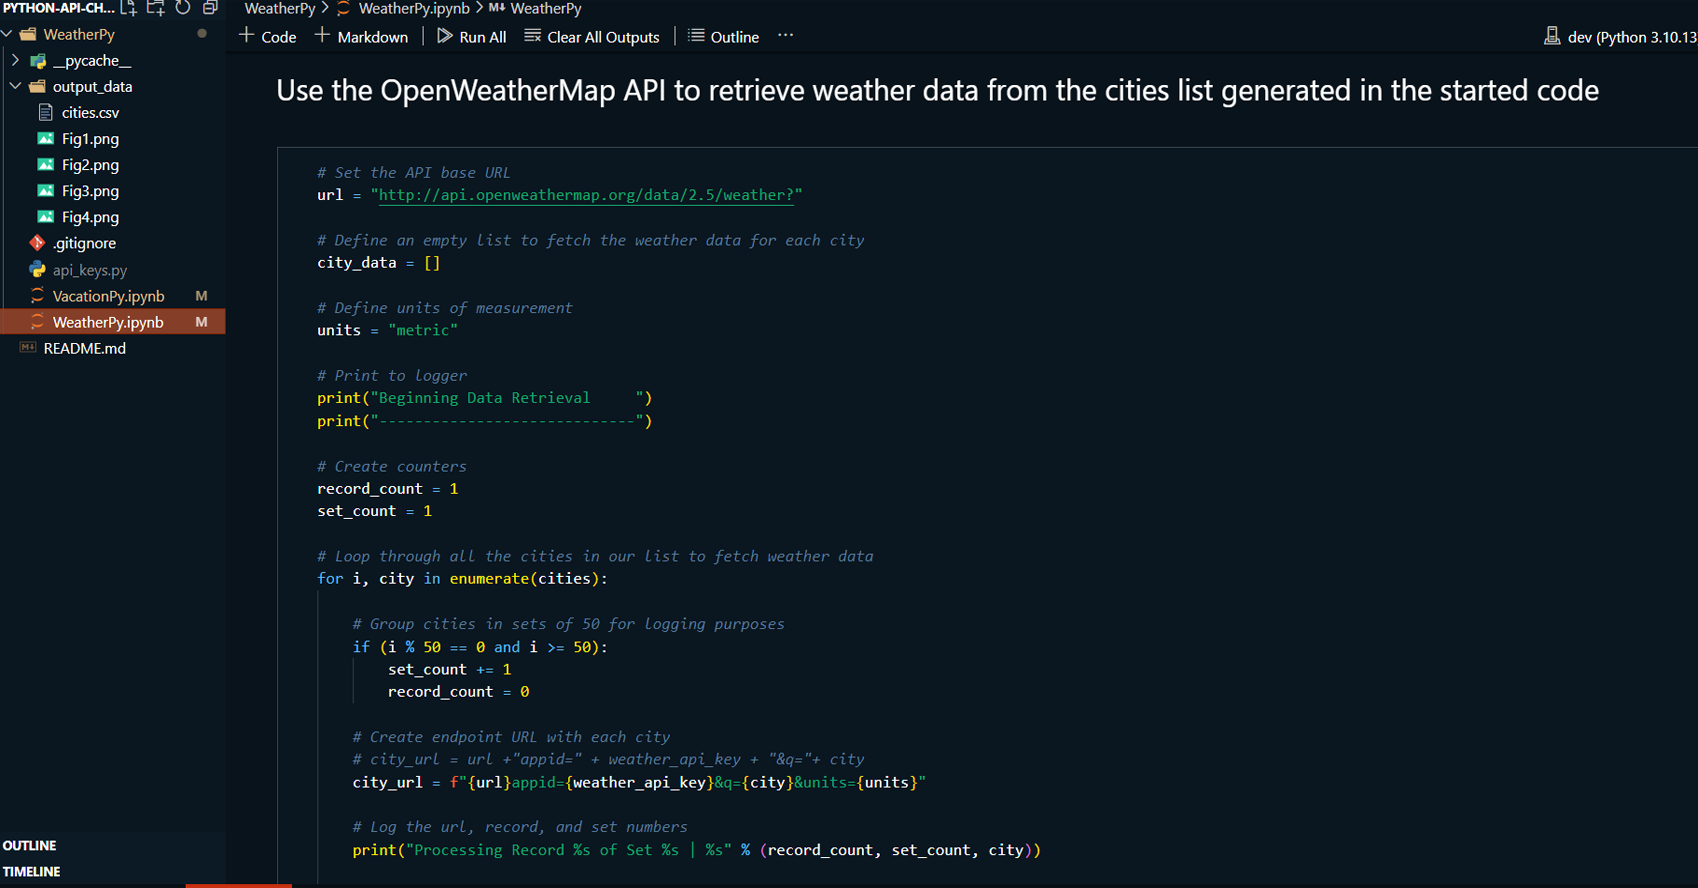
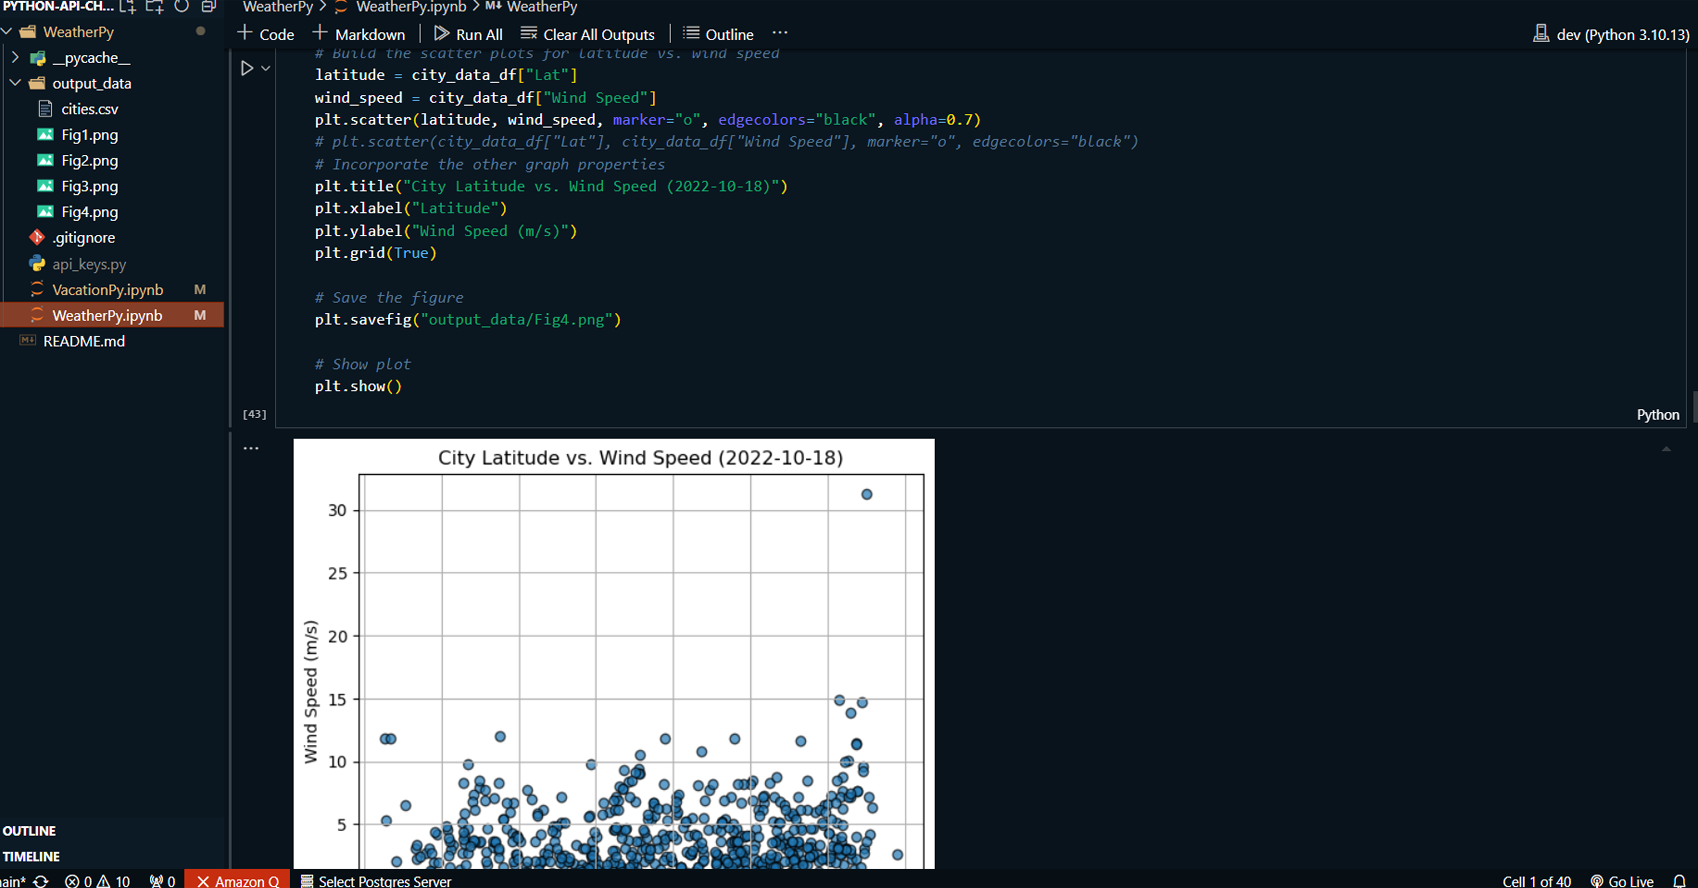
This project uses weather data and location-based data from APIs to analyze weather trends across various global cities and identify ideal vacation spots based on specific weather conditions. The project is divided into two parts:
-
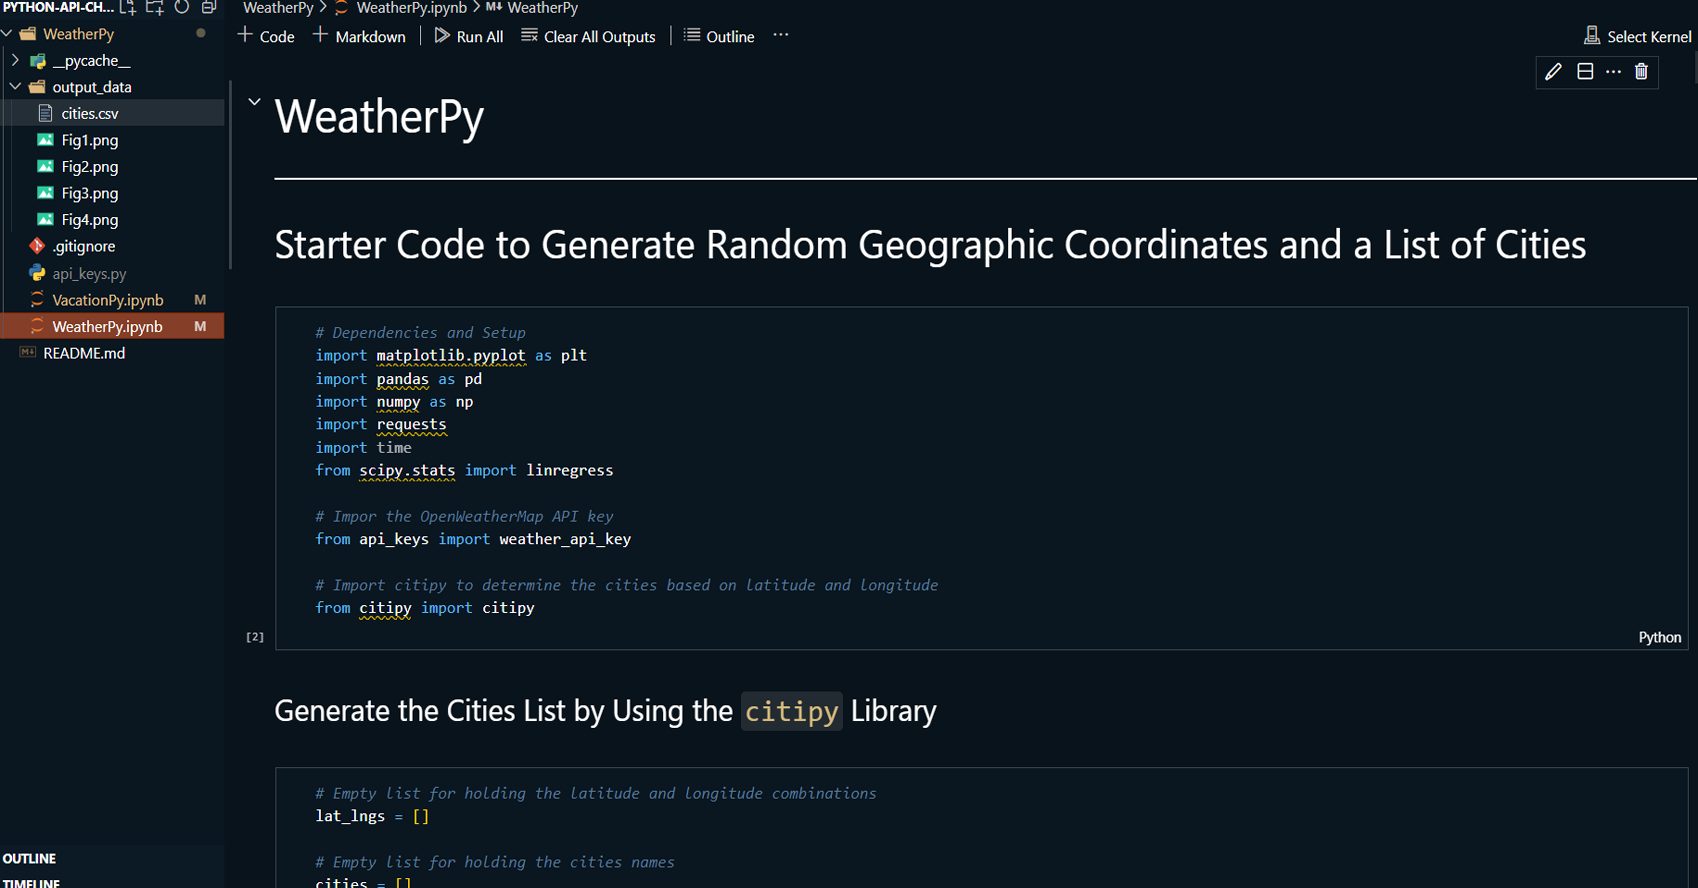
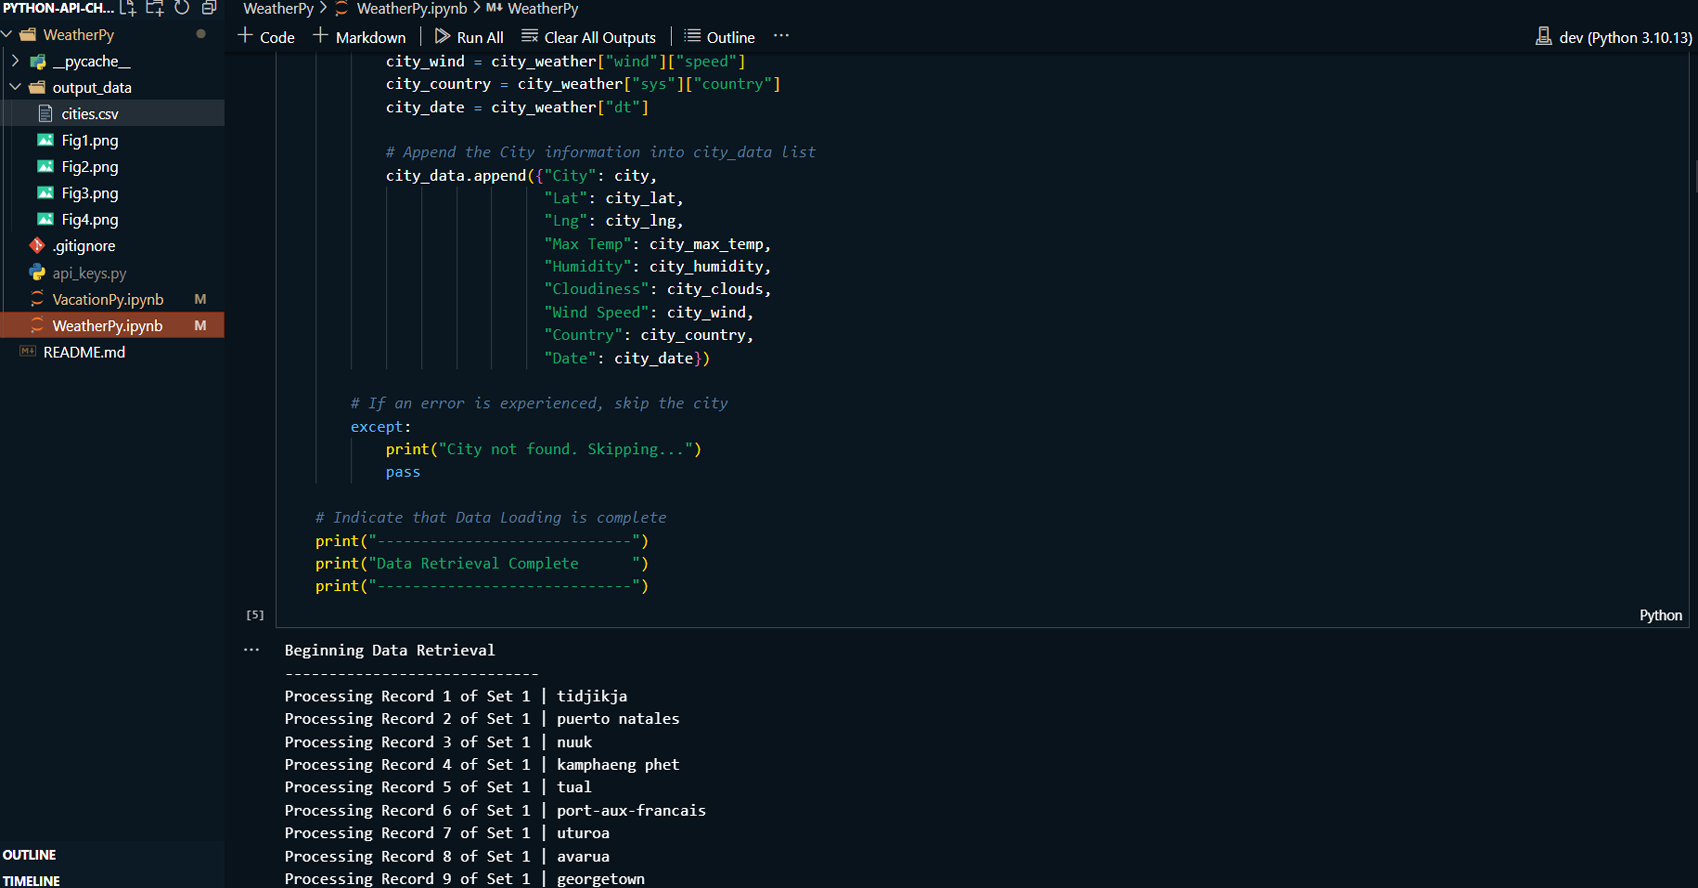
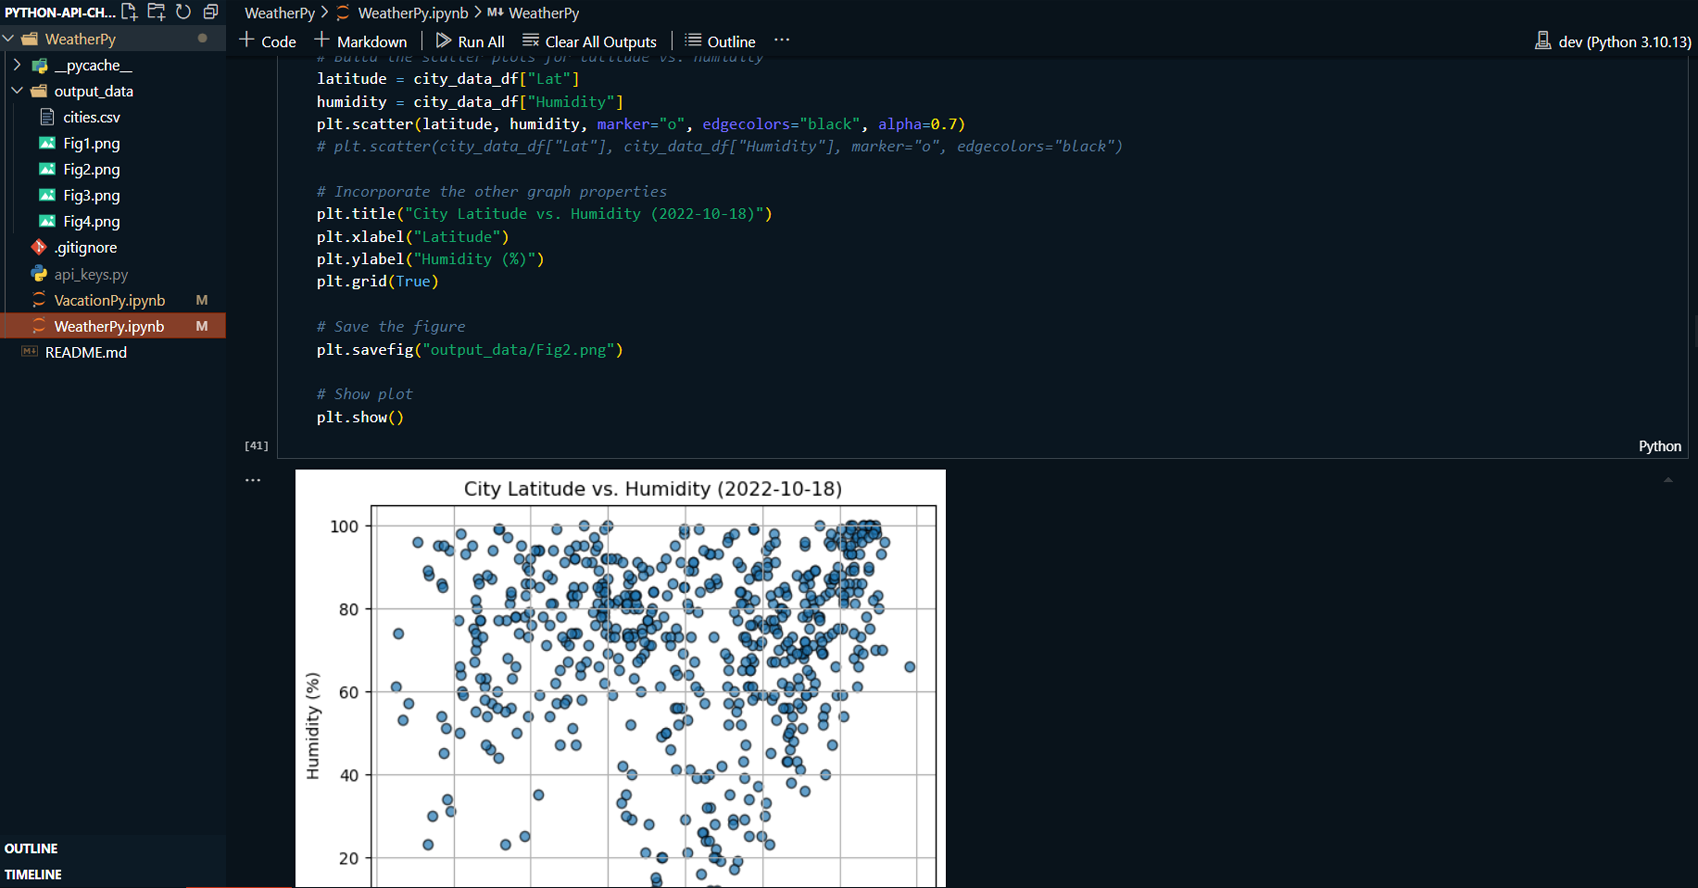
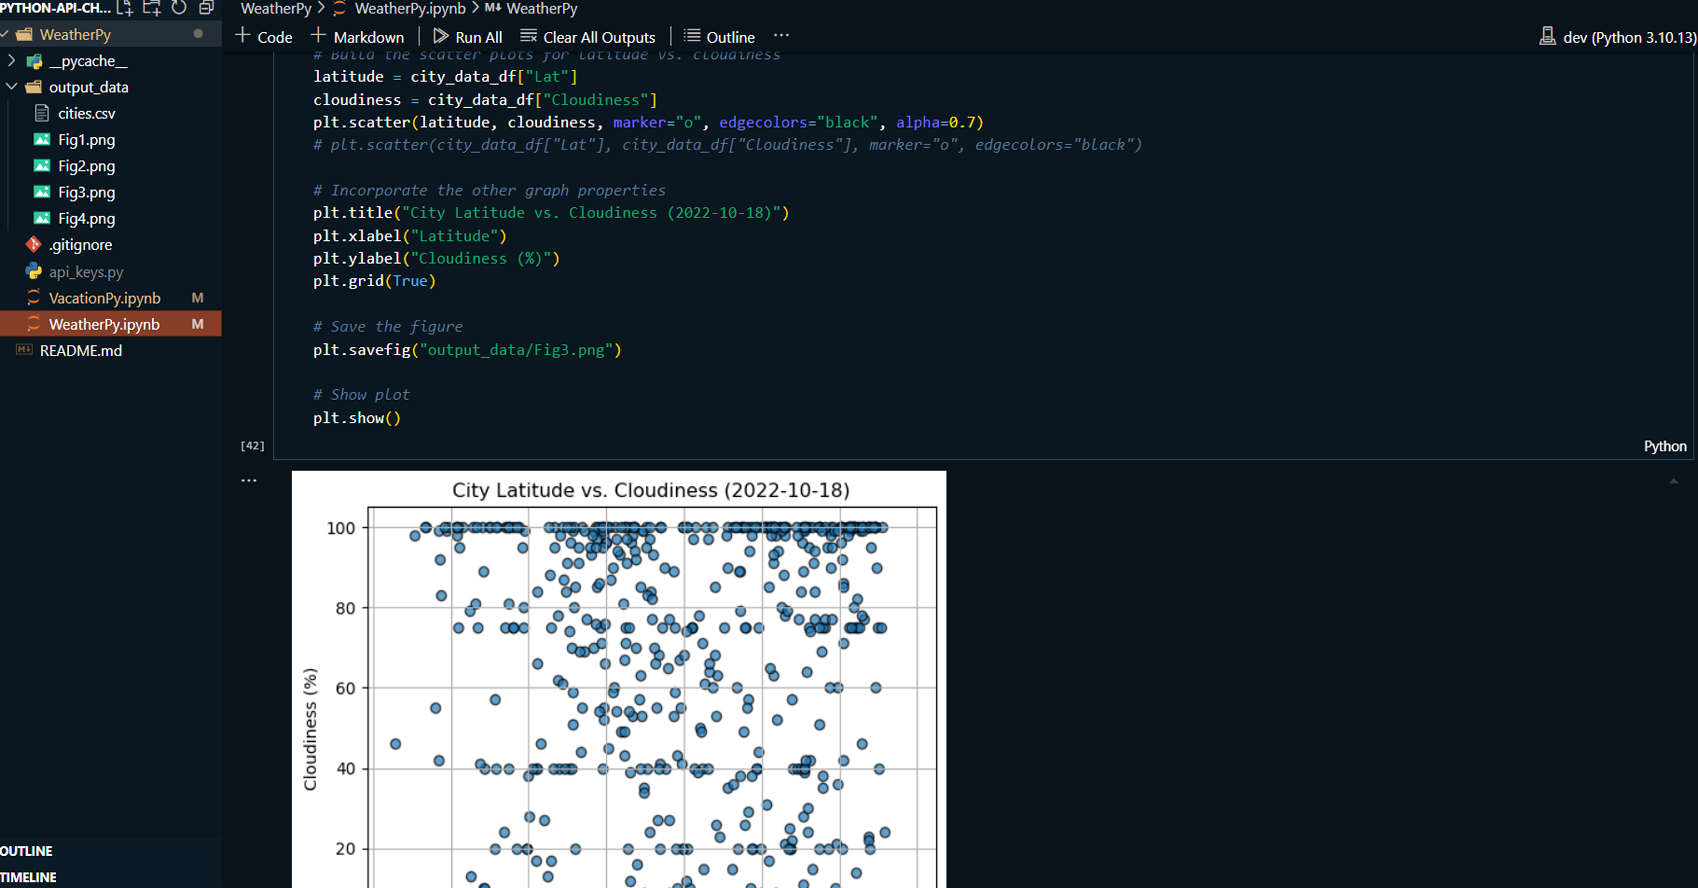
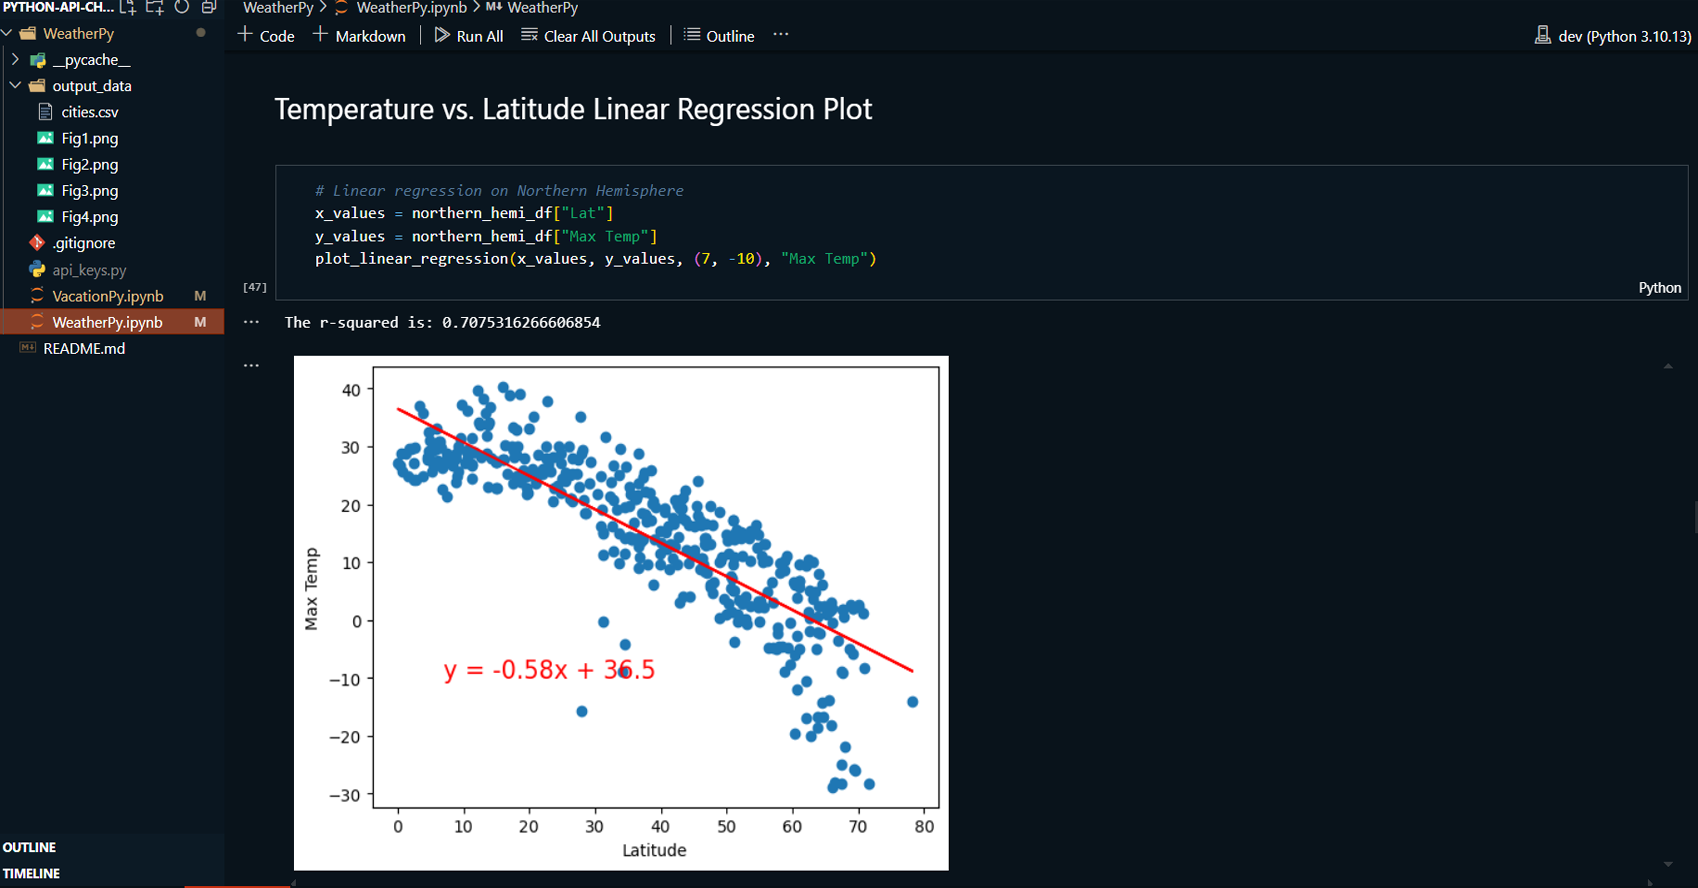
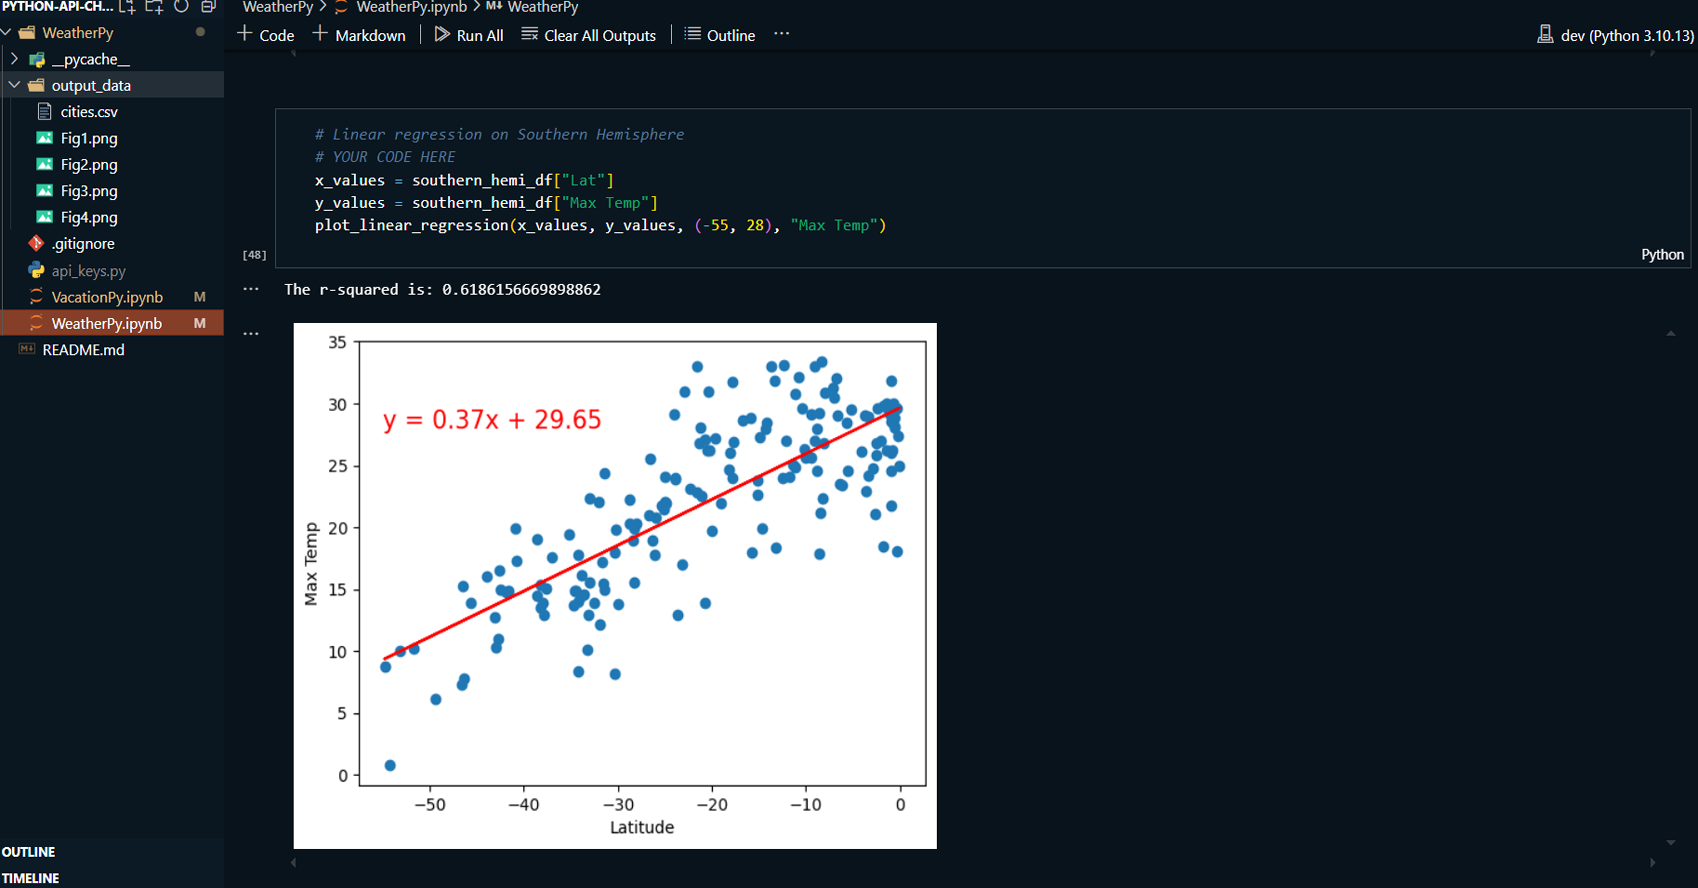
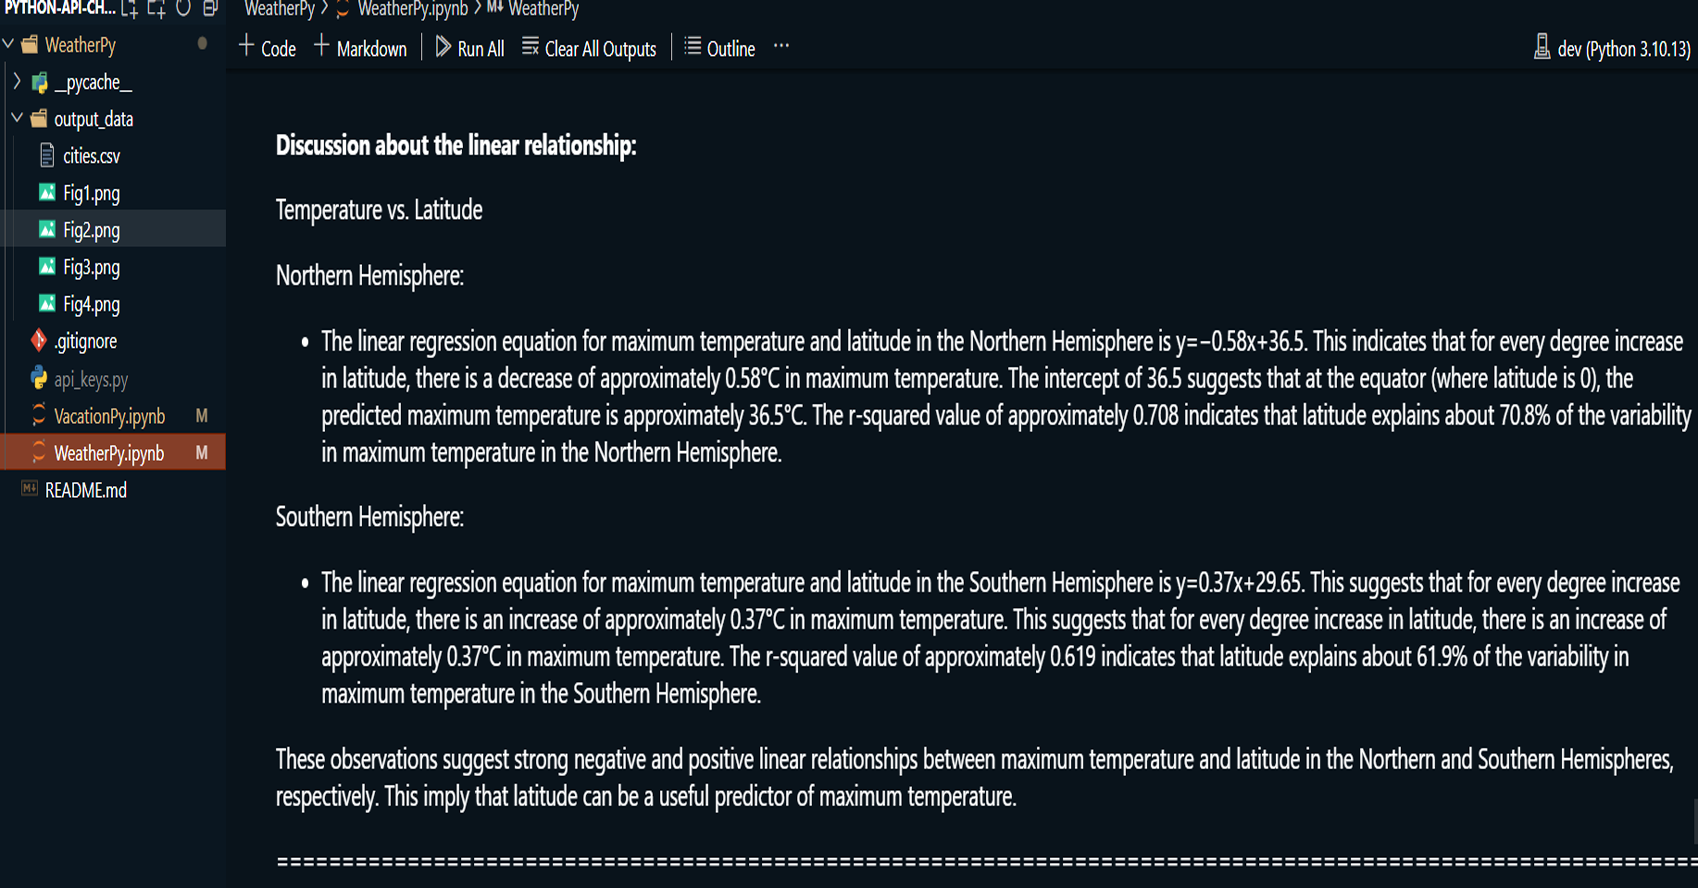
WeatherPy: A comprehensive analysis of weather variables, such as temperature, humidity, cloudiness, and wind speed, in relation to latitude. Using data from the OpenWeatherMap API, this analysis includes visualizations through scatter plots and linear regression models to compare weather trends between the Northern and Southern Hemispheres.
-
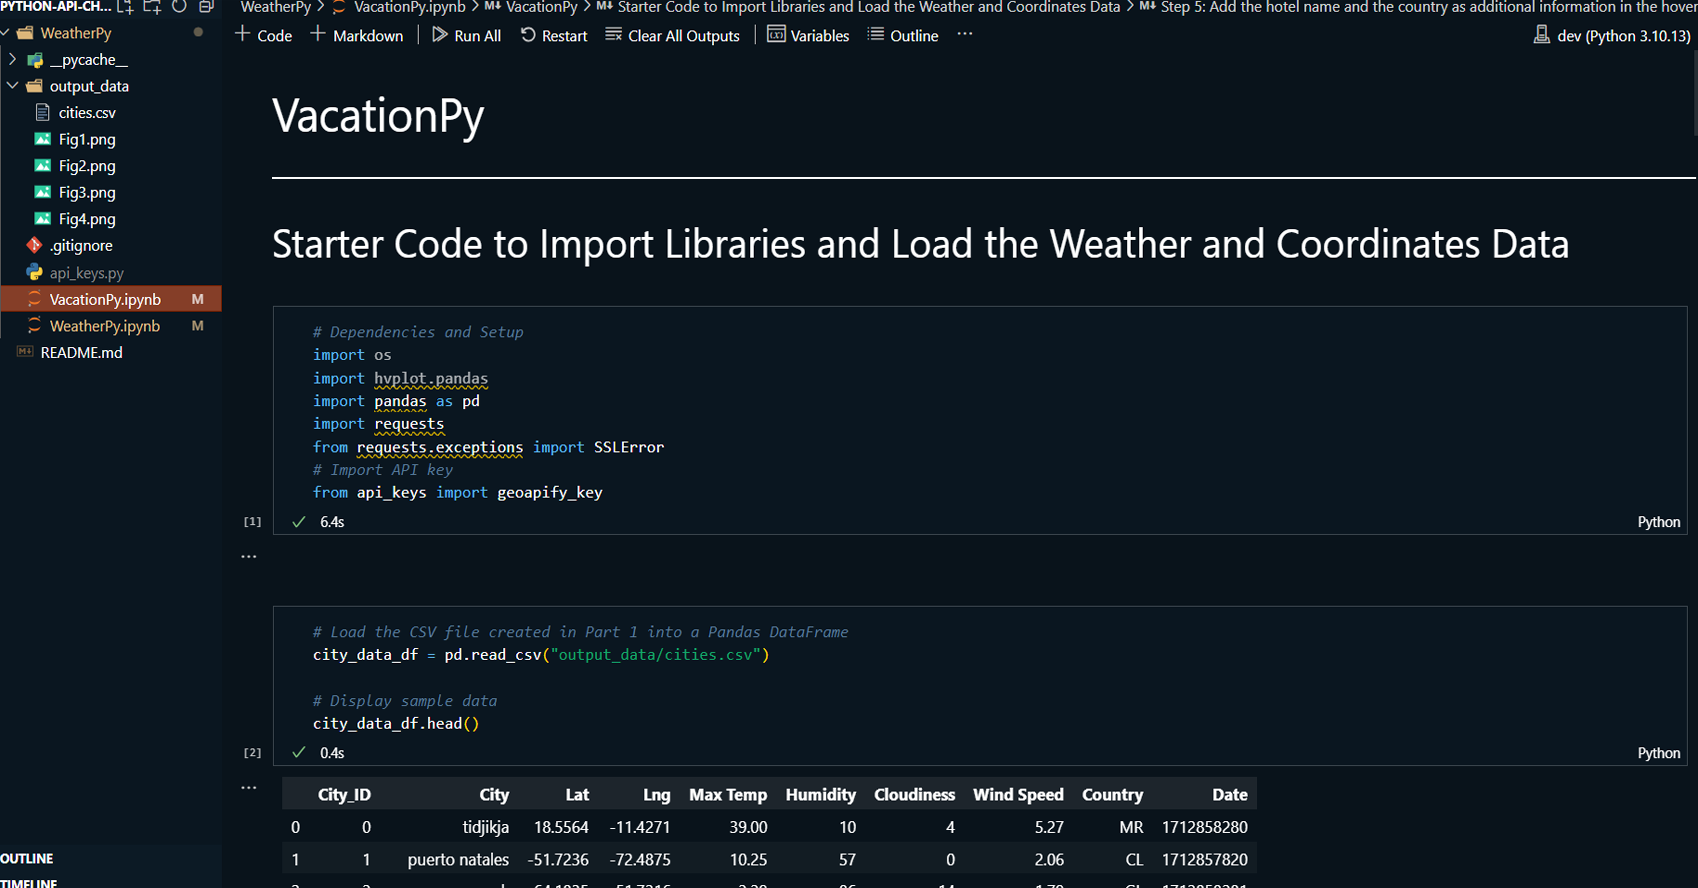
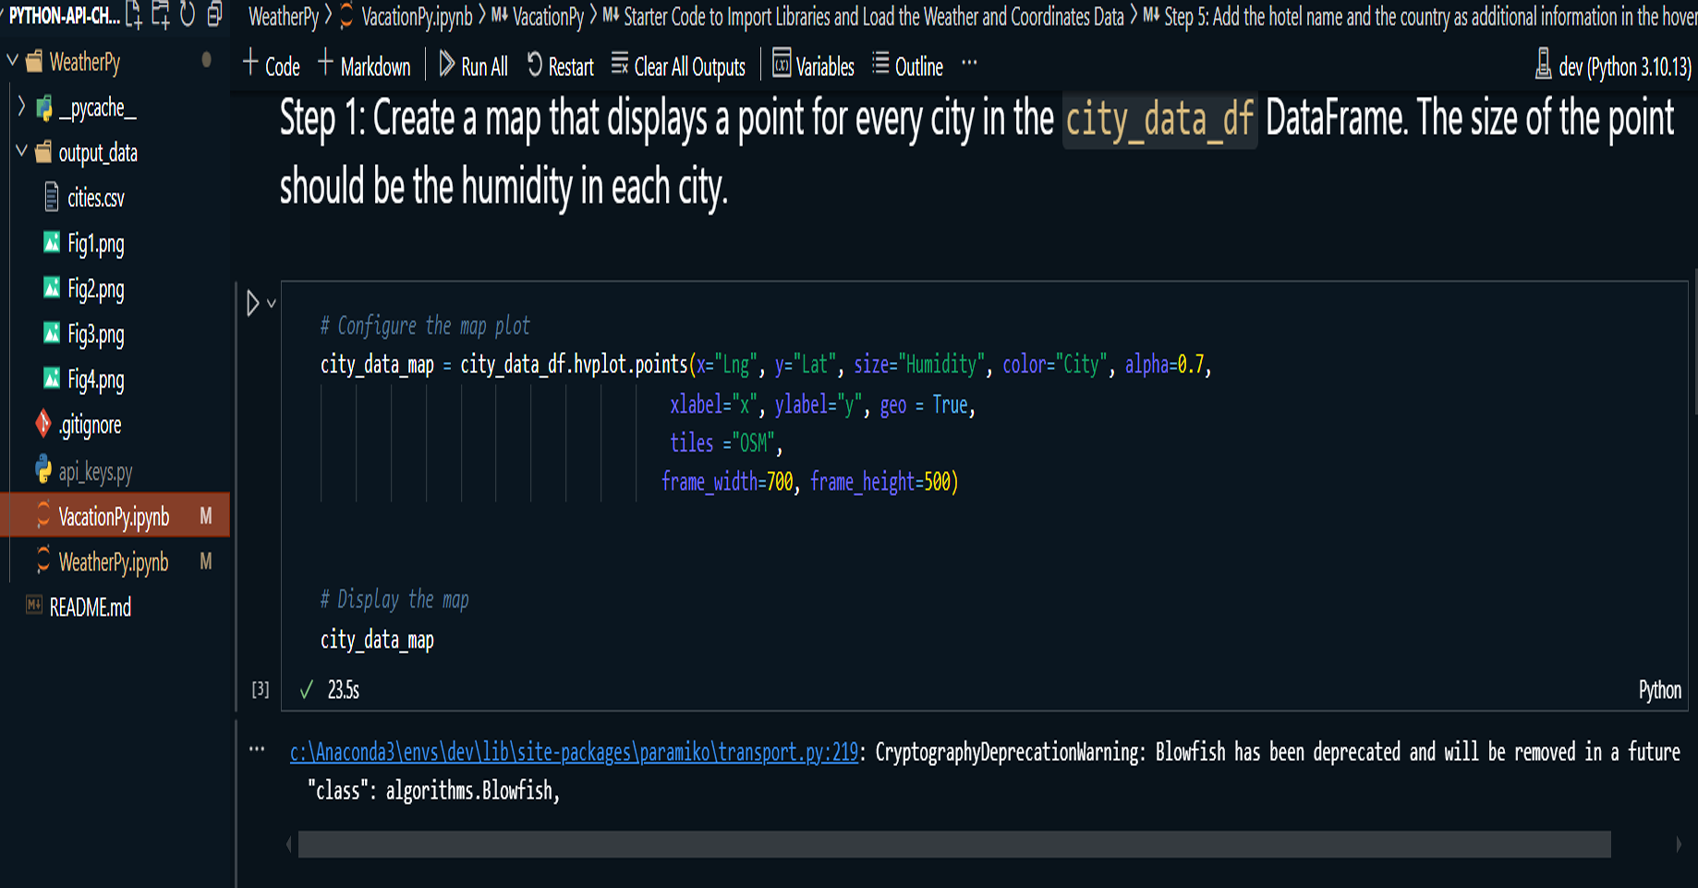
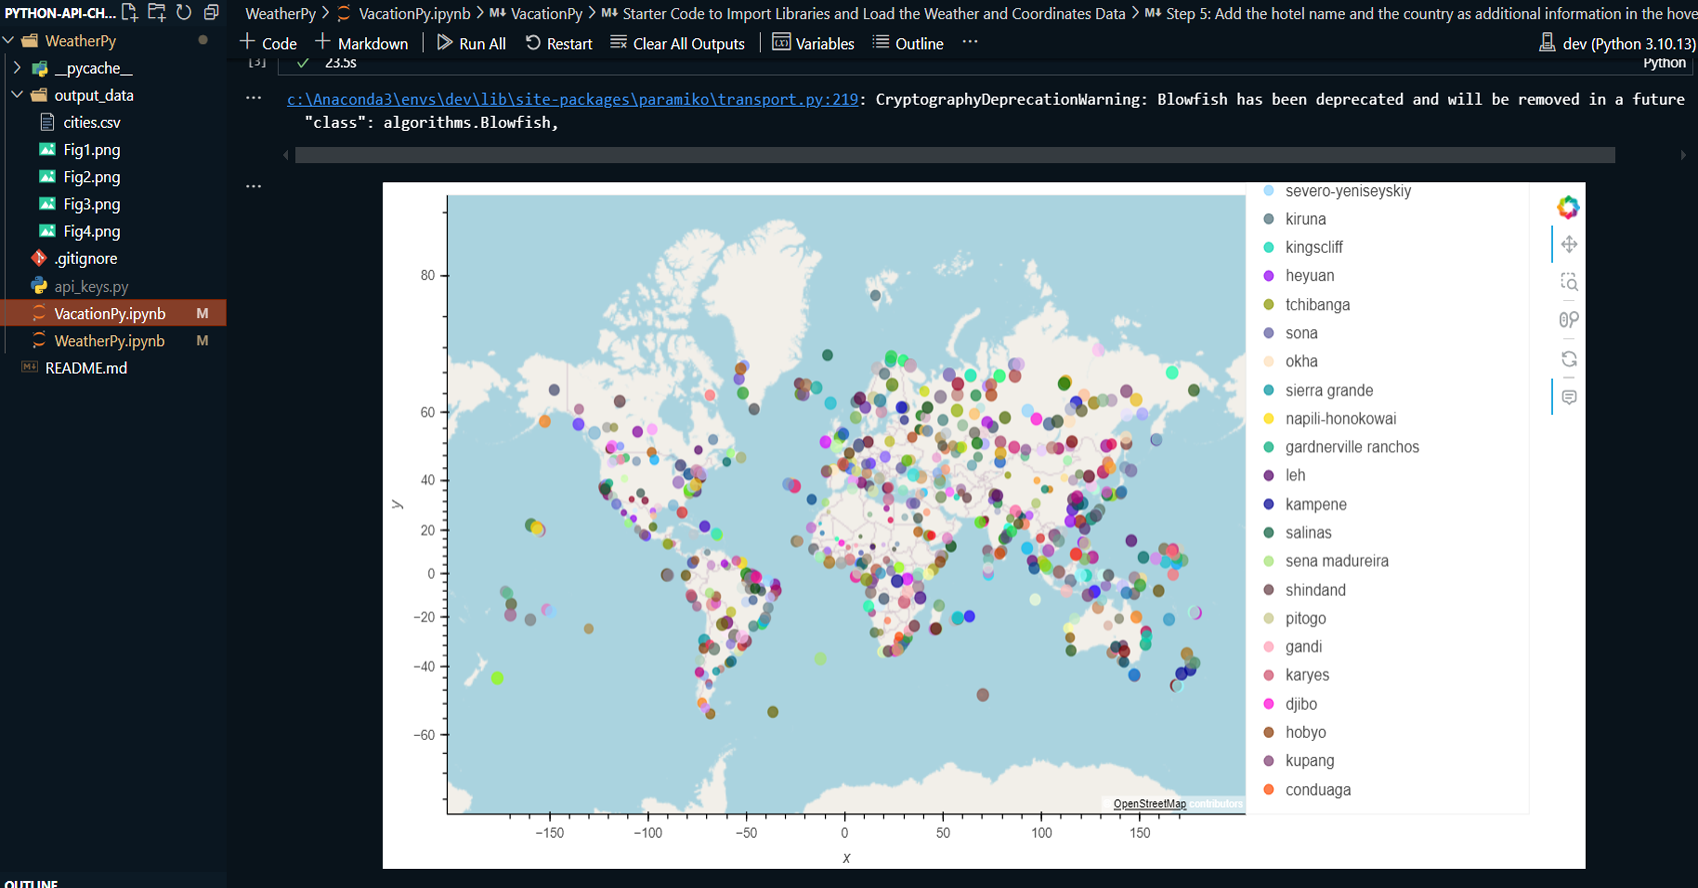
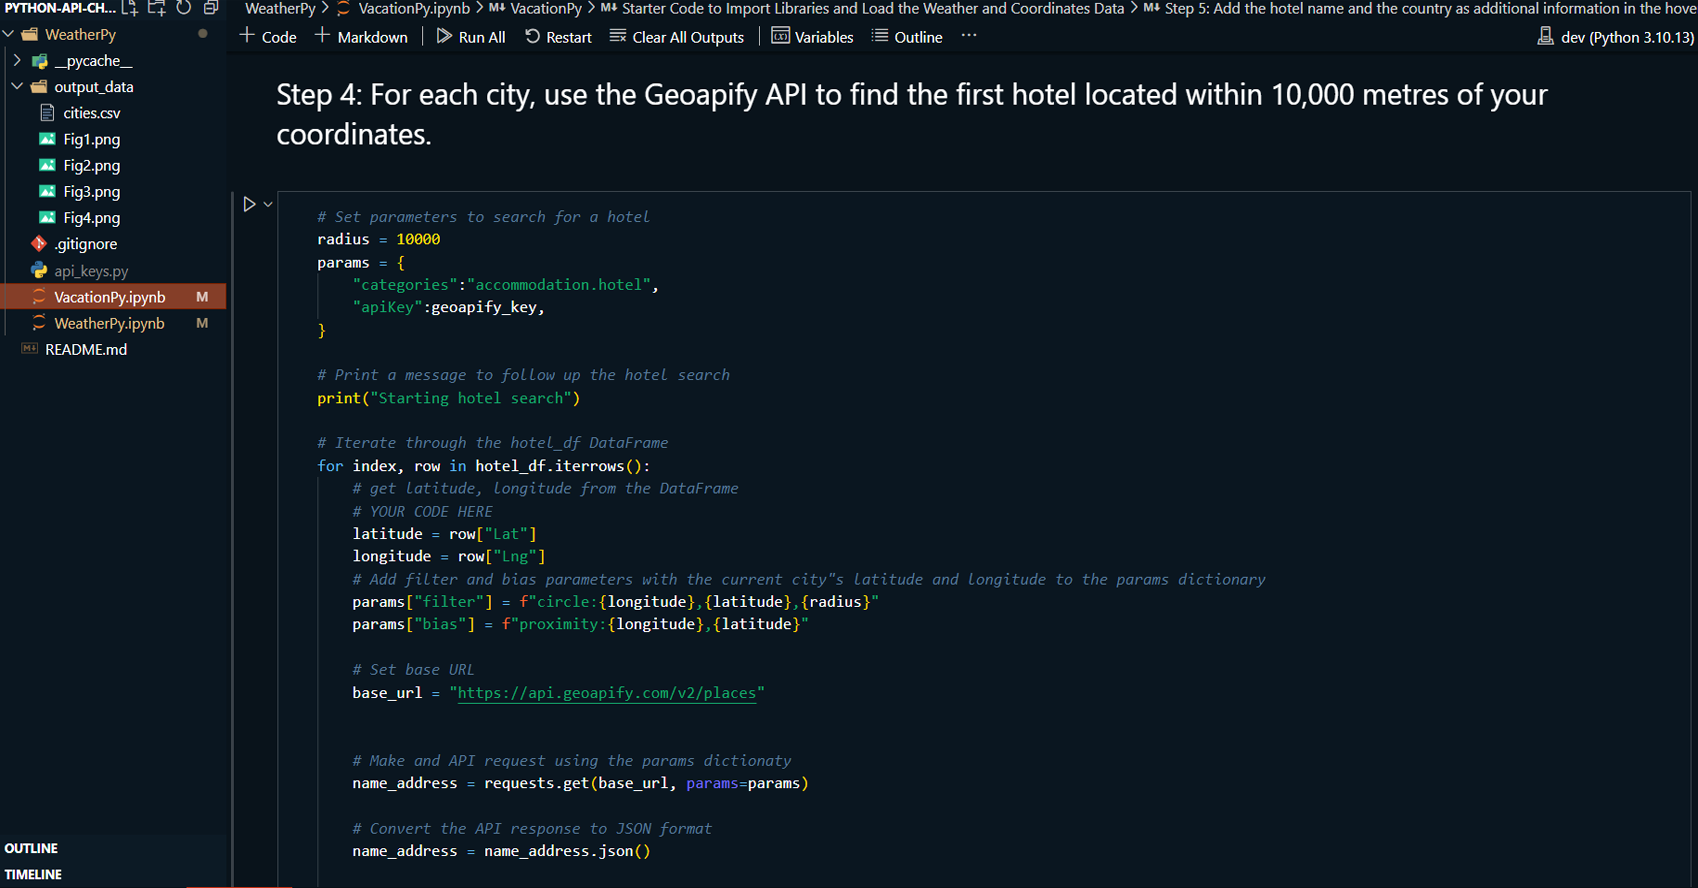
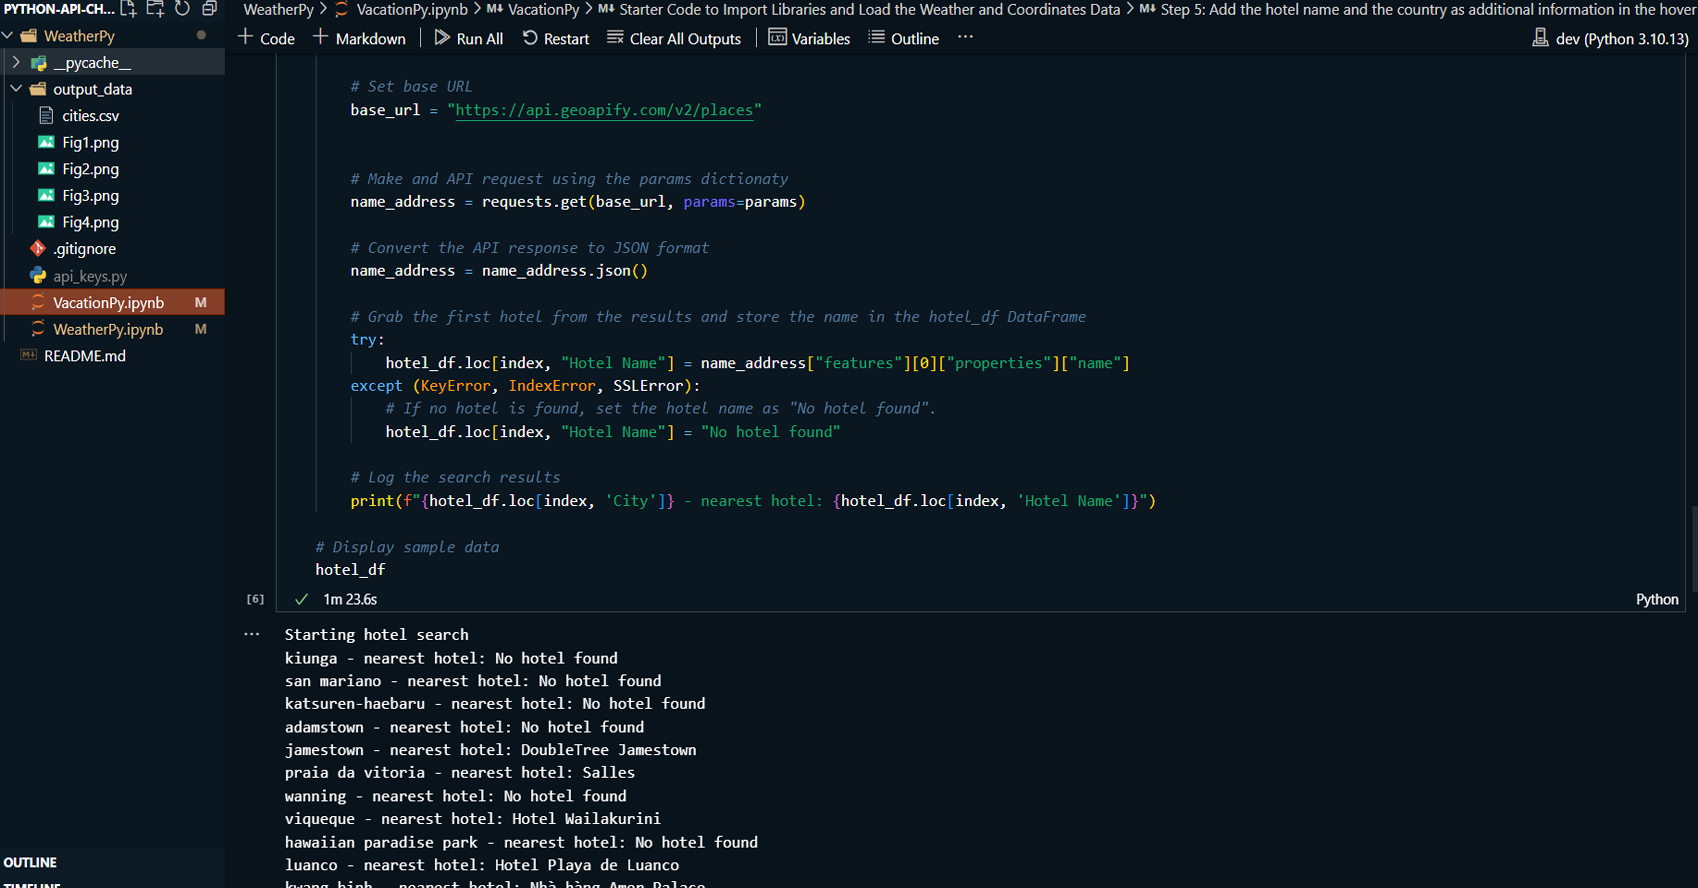
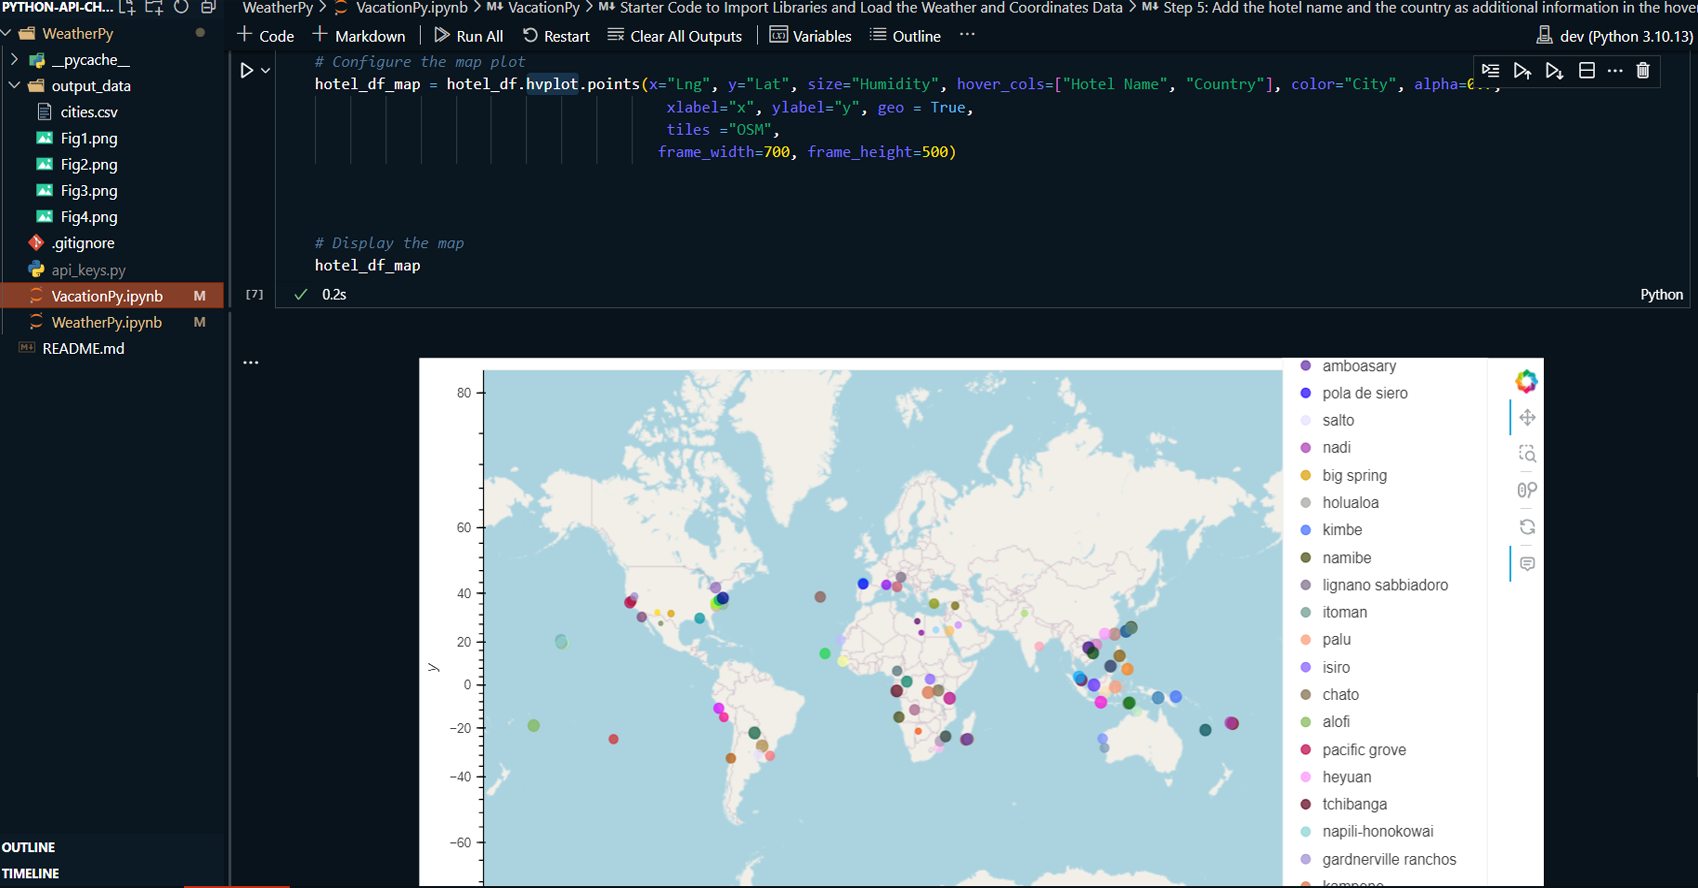
VacationPy: Utilizing weather data from WeatherPy, the project identifies ideal vacation destinations based on specific weather conditions, such as moderate temperature and low humidity. The Geoapify API is used to locate nearby hotels within a 10,000-meter radius of selected cities, and the results are plotted on an interactive map.
Read More
Technologies:
-
Python: Primary language for data analysis and API interaction.
-
Pandas: For data manipulation and analysis.
-
Matplotlib & hvplot: For scripting database
interactions
-
Scipy For performing linear regression analysis.
-
Citipy: To generate random city lists based on geographical coordinates.
-
OpenWeatherMap API: To retrieve weather data for the selected cities.
-
Geoapify API: To locate hotels within proximity of the ideal vacation spots.
-
Jupyter Notebook: For interactive code execution and analysis.
-
Git: For version control and repository management.
-
VSCode: As an alternative IDE to Jupyter Notebook.
Highlighted Skills:
-
Data Collection & Preparation:
-
Generated a list of random cities using the Citipy library based on geographical coordinates.
-
Retrieved real-time weather data for the cities using the OpenWeatherMap API.
-
Cleaned and formatted the retrieved weather data into a Pandas DataFrame and exported it as a CSV file for further use.
-
Data Analysis & Visualization:
-
Created multiple scatter plots to analyze the relationship between weather variables (temperature, humidity, cloudiness, wind speed) and latitude.
-
Applied linear regression to model the relationship between these weather variables and latitude for both the Northern and Southern Hemispheres, producing regression plots.
-
Vacation Destination Identification:
-
Filtered the weather data to find ideal vacation spots based on user-defined criteria (e.g., moderate temperatures and low humidity).
-
Retrieved hotel data for cities meeting the criteria using the Geoapify API and created a new DataFrame to store city, country, coordinates, and hotel data.
-
Plotted an interactive map displaying vacation destinations and nearby hotels within a 10,000-meter radius using Geoapify.
-
Technical Setup & Execution:
-
Documented the step-by-step instructions for running the project, including installation of required libraries and API keys.
-
Provided clear guidance for cloning the repository, setting up dependencies, and running the analysis in Jupyter Notebook using VSCode IDE.
GitHub Link: To see my project on GitHub
please click GitHub Repository button below
